2.2 - Example: Colon Cancer Data
To illustrate some of the statistical issues, we will use some human colon cancer data available in R. There are 40 samples from tumors "t" and 22 samples are from normal "n" biopsies. The data was originally collected on microarrays with 6500 probes. 2000 of them were selected apparently, randomly, to be used for demonstrating statistical methods. These data are somewhat more complicated than most of the data sets we will use because the 22 normal biopsies came from an unaffected part of the colon of the same patients that also contributed cancer tissue. Therefore, we have to account for correlation between samples for those 22 patients. The other samples are all independent. It is not unusual to have paired samples of this type, but it is unusual to have both paired and unpaired samples. We will see later in the course how the linear mixed model can be used to handle this situation.
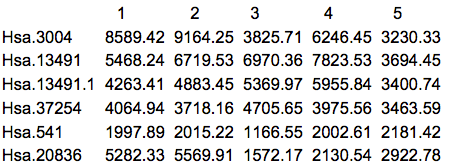
The first thing that we should do is to actually look at the data. Here are the first 5 rows and columns of the raw intensity scale data.
There are many things that can be ascertained by simply looking at the data. First of all, it's always good to know what you have been given, especially since we often work with multiple labs which might give the data in somewhat different formats or list the features in different order. Frequently I have received data from the same lab from the same study in which the genes were in a different order, or in which some of the samples appeared in two different spreadsheets. Another common situation is that some data are missing. R can accept a blank cell or a cell with NA (Not Available) as missing. Asterisks (*) and other commonly used symbols need to be replaced before reading the data into R.
Micro-array data is on a continuous scale so usually has a decimal place. Often log2 is taken, which typically makes the data values between 4 and 16. With sequencing data you should see counts, with some of them being zero. A common mistake is working with the data on the wrong measurement scale.
Most "omics" data will include feature names and possibly other annotation. R will interpret certain characters such as quotes and $ as terminators. For this reason the data might not be entered in properly. Before proceeding with your analysis, you need to make sure that the data have the right number of rows and columns and the gene names are acceptable.

