14.1 - Example: Bone Marrow Cancer Data
Example
We will explore classification using the 10 most differentially expressed genes from a study using 99 Affymetrix microarrays from GSE47552 which focused on the differences in gene expression among normal, transitioning and cancerous bone marrow samples. The number of samples for each of the 4 bone marrow types are summarized below:
| Normal | 5 |
| MGUS | 20 |
| SMM | 33 |
| MM | 41 |
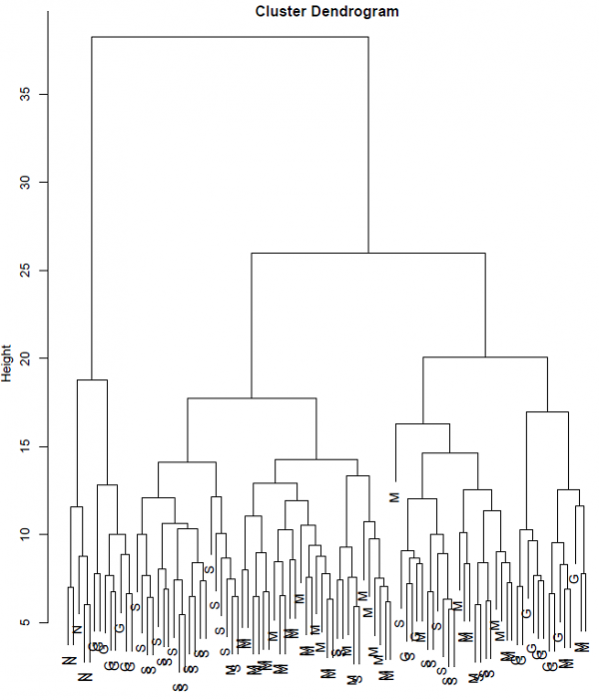
To give some idea of the challenge of finding a classification rule for these 99 samples, we start with a cluster diagram based on the 120 most differentially expressed genes. As can be seen below, even with 120 genes, the samples do not cluster cleanly by marrow type. We will see how well we can do with classifying the samples using only 10 genes.
As always, before starting an analysis, we should explore the data. I usually use scatterplots. Since our objective is to classify the samples using the gene expression, let's start by looking at all the samples using a scatterplot matrix based on the genes. Here I display only the 5 most differentially expressed genes, due to space limitations. The sample types are plotted in color where Normal is green, is "G" black, "M" is red and "S" is blue. We can see that we should be able to do well in classifying the Normal samples, and reasonably well in classifying the "G" samples, but distinguishing between "M" and "S" might be difficult.
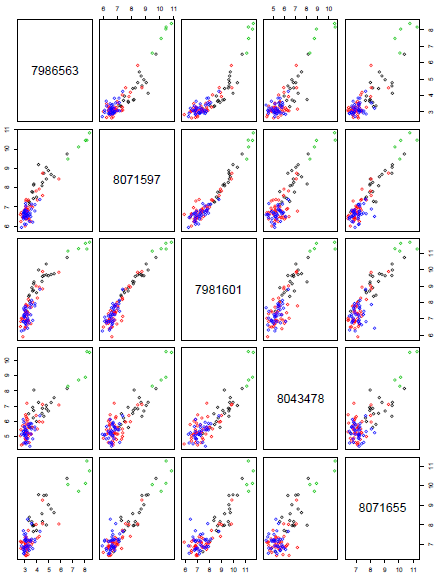
We can see that this set of highly differentially expressed genes are also highly correlated with each other. As well, we can see that the Normal group (green) is fairly well separated from the other samples using any pair of genes but that the cancerous samples are intermingled.
Note as well that the usefulness of a gene set for classification (or prediction) is not the same as the usefulness of the gene set for understanding the biological process which created the condition. The genes useful for classification need only be associated with the phenotype - they are not necessarily causal.

