R codes for Data Preparation and Exploratory Data Analysis
TexturePred <- Texture[,-41]
TextureClass <- Texture[,41]
PCTexture <- princomp(TexturePred, cor=T)
screeplot(PCTexture, col=c("royal blue","blue","dark blue","light blue", "purple","grey"))summary(PCTexture)
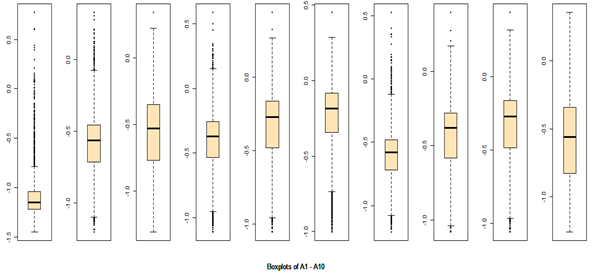
par(mfrow=c(1,10), oma = c(1,1,0,0) + 0.1, mar = c(3,3,1,1) + 0.1)
for (i in 1:10) {boxplot(TexturePred[,i], pch=19, col="moccasin")
mtext("Boxplots of A1 - A10", cex=0.8, side=1, line=0, outer=T)}
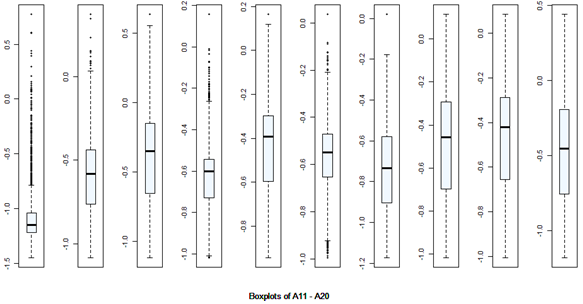
for (i in 11:20) {boxplot(TexturePred[,i], pch=19, col="aliceblue")
mtext("Boxplots of A11 - A20", cex=0.8, side=1, line=0, outer=T)}
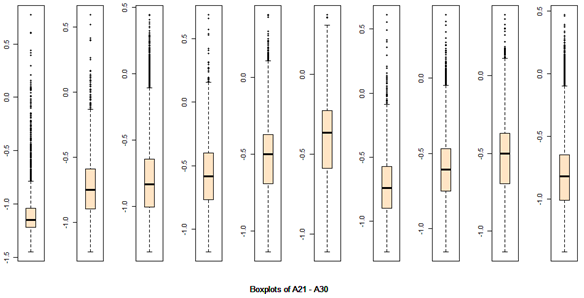
for (i in 21:30) {boxplot(TexturePred[,i], pch=19, col="bisque1")
mtext("Boxplots of A21 - A30", cex=0.8, side=1, line=0, outer=T)}
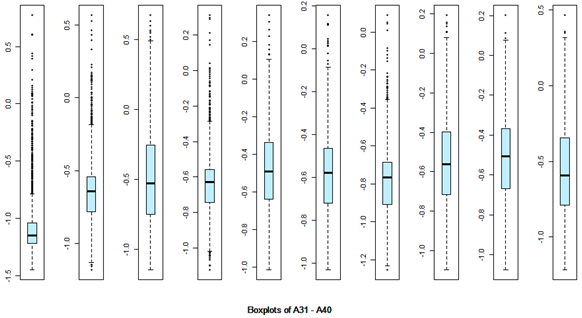
for (i in 31:40) {boxplot(TexturePred[,i], pch=19, col="lightblue1")
mtext("Boxplots of A31 - A40", cex=0.8, side=1, line=0, outer=T)}
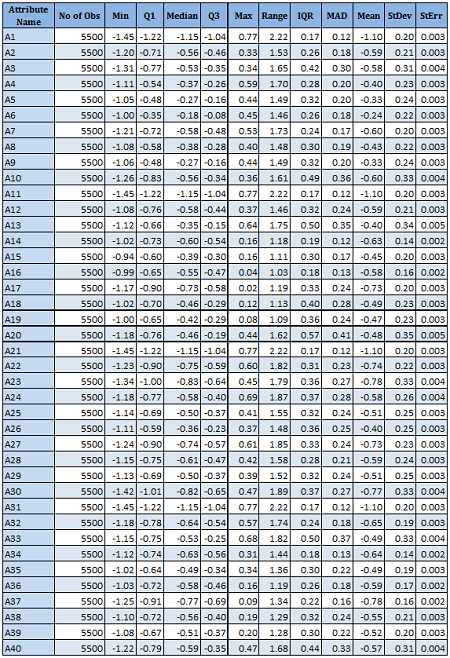
DescTex <- describe(TexturePred)
Qm <- matrix(0, nrow(DescTex), 3)
DescTex <- cbind(DescTex, Qm)
for (i in 1:nrow(DescTex)){DescTex[i,14] <- quantile(TexturePred[,i], 0.25)
DescTex[i,15] <- quantile(TexturePred[,i], 0.75)
DescTex[i,16] <- DescTex[i,15]-DescTex[i,14]
}
write.csv(DescTex, "C:/Users/sbasu/Desktop/Stat 897D/DescTex.csv")
######### Outlier rejection ##############
limoutL <- rep(0,40)
limoutU <- rep(0,40)
for (i in 1:40){t1 <- quantile(TexturePred[,i], 0.75)
t2 <- quantile(TexturePred[,i], 0.25)
t3 <- IQR(TexturePred[,i])
limoutU[i] <- t1 + 3*t3
limoutL[i] <- t2 - 3*t3
}
TxPrdIndexU <- matrix(0, 5500, 40)
TxPrdIndexL <- matrix(0, 5500, 40)
for (i in 1:5500)
for (j in 1:40){if (TexturePred[i,j] > limoutU[j]) TxPrdIndexU[i,j] <- 1
if (TexturePred[i,j] < limoutL[j]) TxPrdIndexL[i,j] <- 1
}
TxIndU <- apply(TxPrdIndexU, 1, sum)
TxIndL <- apply(TxPrdIndexL, 1, sum)
TxInd <- TxIndU + TxIndL
TxPrdTemp <- cbind(TxInd, TexturePred)
Indexes <- rep(0, 128)
j <- 1
for (i in 1:5500){if (TxInd[i] > 0) {Indexes[j]<- ij <- j + 1}
else j <- j
}
TxPredLib <- TexturePred[-Indexes,] # Inside of Q3+3IQR Predictors
TxClassLib <- TextureClass[-Indexes] # Inside of Q3+3IQR the class column
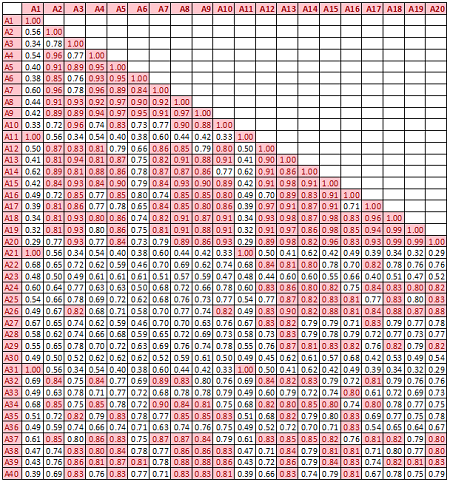
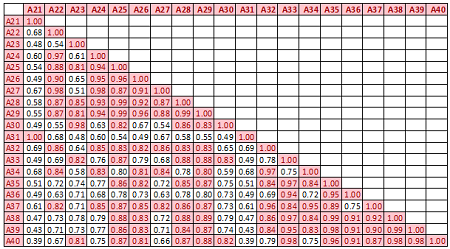
############ Correlation #############
TexturePredCor <- cor(TxPredLib)
write.csv(TexturePredCor, "C:/Users/sbasu/Desktop/Stat 897D/CorrTex.csv")
From the above univariate exercises, it is clear that several of the 40 attributes have outliers of varied proportion. In order to include as many rows as possible, but eliminating the extreme outliers, all data points (rows) were included, which do not contain any outlier value in any of the 40 predictors, outliers being defined as a value outside of [Q1-3IQR, Q3+3IQR] limits. This eliminates 128 rows. A more conservative approach is where the outlier is defined to be a point outside of the limit [Q1-1.5IQR, Q3+1.5IQR]. In this case, 1060 rows would have been removed.
While looking at the correlation matrix it was found that there is a very high degree of dependency among the predictor variables. The red highlighted cells all show very high degree of dependency and it is all in the positive direction.