CD.3: 10-Fold Cross-validation
Since data set is large enough, 10-fold cross-validation is applied to evaluate model performance. After removing the outliers 5372 observations are included in the master data and the first 8 principal components are used for prediction. For each observation (row) a score corresponding to each PC is computed and this is the value of the predictors (PCs) used to evaluate model performance. Hence the master data used has 5372 rows (observations) and 8 predictors and one response (total of 9 columns) indicating the classes each observation belongs to.
Data is divided into 10 sets randomly of which 9 sets have 537 observations and the last set has 539 observations. Training data is formed by taking 9 sets at a time and leave one set out as the Test data. Hence 10 different combinations of Training and Test sets are formed. On each of Training and Test pair a technique is applied and evaluated. Final evaluation of the technique is determined by the average mis-classification probability over the 10 Test sets.
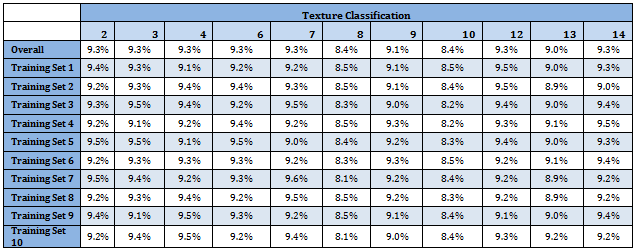
Following table shows classification proportion in the Master data as well as in the Training data sets. Distribution of different classes is almost identical over the data sets. Moreover all categories have almost uniform representation
Linear Discriminant Analysis
R codes for
Discriminant Analysis
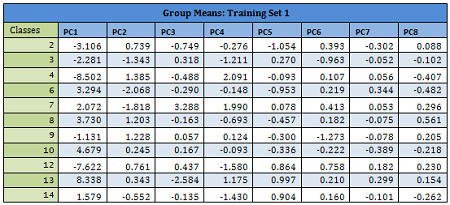
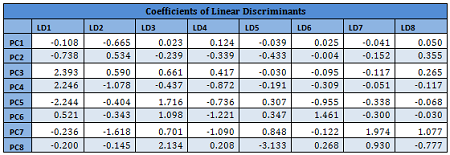
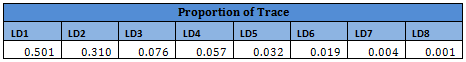
Since PCs are linear combinations of original variables, they may also be assumed to follow multivariate normal distribution. For each Training set a linear discriminant function is developed using all 8 PCs. Prior probability distribution for each Training set is very similar as given in the table above.
Details are given for the Training Data 1:
Results from other Training sets are also very similar and are not shown here. In the following table misclassification probabilities in Training and Test sets created for the 10-fold cross-validation are shown.
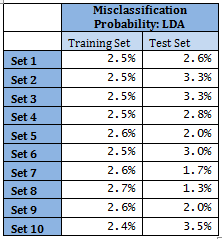
Therefore overall misclassification probability of the 10-fold cross-validation is 2.55%, which is the mean misclassification probability of the Test sets.
Note that for Sets 5, 7, 8 and 9 mis-classification probability in Test set is less than that in the corresponding Training set. This may seem fallacious; however, several points to be noted here. Training set size is much larger compared to Test set. With 11 classes in Test sets, each class has sometimes even fewer than 40 representations. This might lead to the standard error of probability of misclassification to be relatively higher, in turn leading to apparent counter-intuitive results. Average error of Training set is 2.54%.
Overall results indicate accurate and stable classification rules.

