CD.6: Random Forest
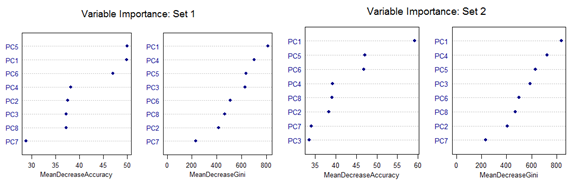
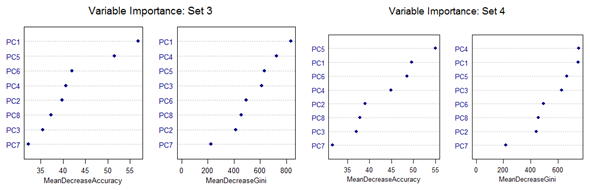
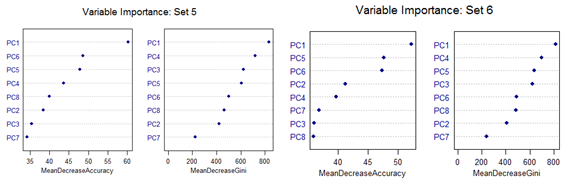
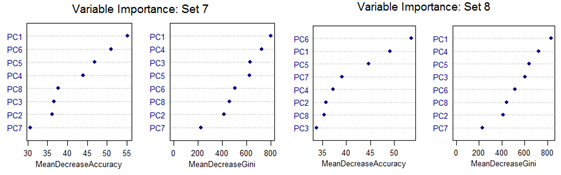
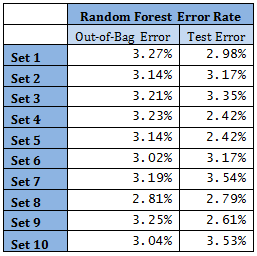
High mis-classification error rate is corrected to a large extent by using Random Forest. Unsupervised random forest method is applied to each Training set and both Out-of-Bag error rate and Test error rate are calculated for error or mis-classification corresponding to each of the 11 categories. Variable importance plots are also shown. All results are for ntree = 100. Number of variables tried at each split is 2.
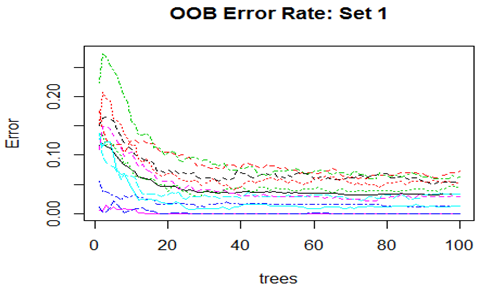
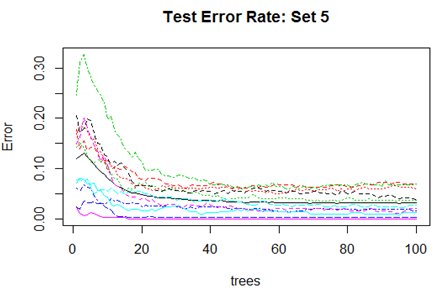
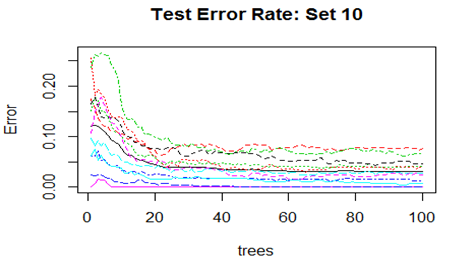
Convergence of the errors are shown for two Sets only since behaviour of the error is very similar for all the 10 Sets random forest technique was applied. For Set 1 both the Out-of-Bag error rate and Test error rate are shown.
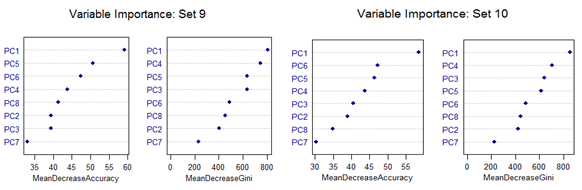
However, there are slight differences in the variable importance plots. All the plots are shown below. It is clear from the plots below that PC1, PC5 and PC6 are the primary influential variables, but they appear in different order in different cross-validation sets.