10.3 - Heatmaps
Heat maps are ways to simultaneously visualize clusters of samples and features, in our case genes. First hierarchical clustering is done of both the rows and the columns of the expression matrix. Usually correlation distance is used, but neither the clustering algorithm nor the distance need to be the same for rows and columns. Then the branches of the dendrograms are rotated so that the blocks of 'high' and 'low' expression values are adjacent in the expression matrix. Finally, a color scheme is applied for the visualization and the expression matrix is displayed.
The branches of the trees are rotated to create blocks in which the individual values are close in both directions. These are color-coded by expression values. (But for correlation distance, we should use z-scores.)
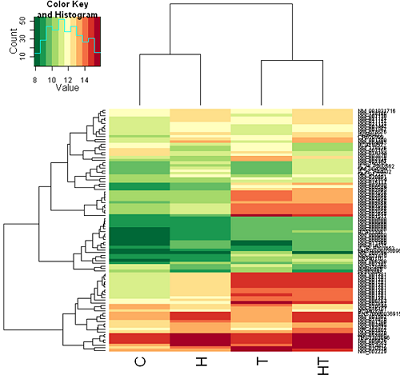
Euclidean distance: Color coding is by mean gene expression
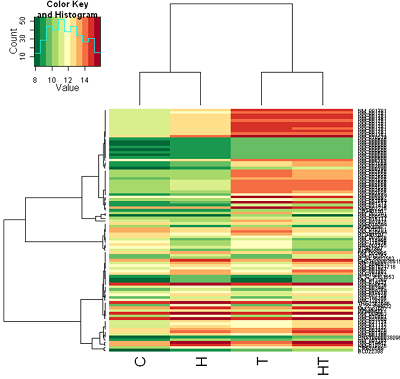
Correlation distance: Color coding is by mean gene expression.
And here is the correlation distance heat map after converting to z-scores of the rows (genes).
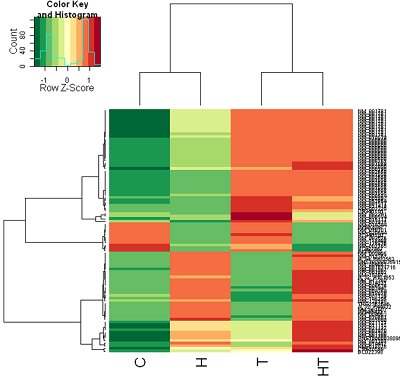
Correlation distance: Color coding after computing z-scores (row scaling)
This looks much better and you can see patterns picked out by the clustering algorithm.
[Please note that all of the default for colors on most of these heat maps is red and green. Given that a certain percentage of the population is red/green color-blind you may want to consider changing these to other colors that don't have this problem.]
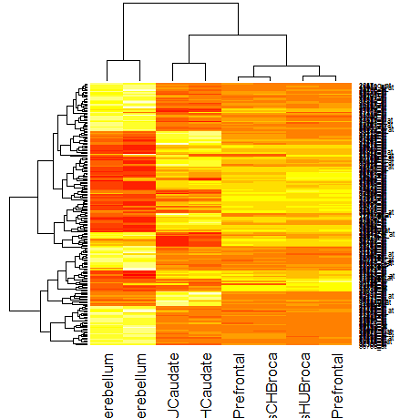
Here are heat maps using yellow and red for colors for the brain study. In the R lab you will have a look at the readily available color schemes and how to apply them.
Heatmap using Euclidean distance
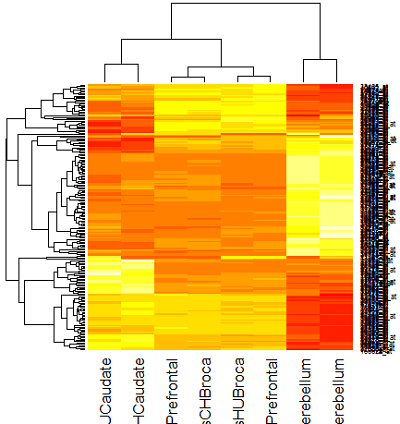
Heatmap using Correlation distance
There are a number of genes that are high in cerebellum for both species and pretty low in other regions. And, there are number of genes that are low in cerebellum and high in other regions. This is pretty interesting for a number of reasons, not the least of which is that all the individuals in the study died of different causes which might have affected gene expression in the brain just prior to death. Nevertheless, a strong pattern is evident for both cerebellum and caudate, which is shared by both species.

