10.6 - Assessing the Clusters Computationally
Clustering is Exploratory
Clustering methods are exploratory - they can be used for data quality assessment and to generate hypotheses. But no matter what goes into the clustering algorithm, clusters come out. This is a classic "garbage in -- garbage out" situation. Of course, we hope that what is going into the analysis is not garbage, but that does not guarantee that pearls of wisdom are coming out.
The bottom line is that the clustering is good if it is biologically meaningful. But, this is hard to assess.
When clustering gene expression, it is better to cluster treatment means than the individual sample values which are noisy. We don't want to cluster on noise -- we want to cluster on the systematic effects that are of interest. However, if you only have a few treatments you are better off clustering samples so that you have some kind of spread of expression.
There are measures of cluster goodness. They work on the principle that distances between items in the same cluster should be small and that distances between items in different clusters should be large. This is an internal check on cluster "tightness" but does not guarantee that the clusters are biologically meaningful.
Look at the plot below. Do you see clusters? Where would you put the cluster boundaries if you planned to have 3 clusters?
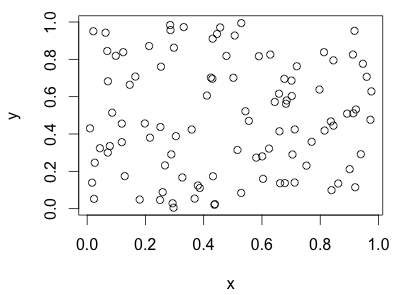
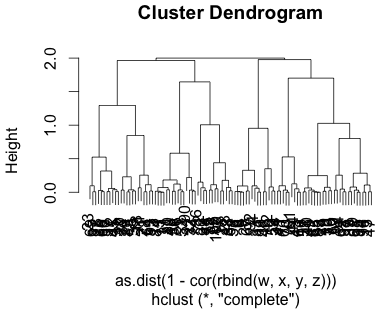
The plot above were completely random points with uniform x and uniform y values. Below is a cluster dendrogram from 4 rows of completely random data.
Measures of Cluster Goodness
The most popular measure of cluster goodness is called the silhouette. You measure the distance between all of the genes in the cluster and look at the maximum distance between genes in the same cluster. Then, you look at the distance between the genes and every other cluster and take the minimum distance between these genes and the closest other clusters. The ratio of these distances is the silhouette. What you want is very tight distances within clusters and long distances between clusters so the ratio will be small.
Another assessment is a stability analysis. If the clusters are close together and you perturb the data a little bit then you get different clusters. However, if the clusters are far apart and you move the data a little bit, the same clusters appear. How do you perturb the data? There are two commonly used methods: resampling and adding noise.
Resampling (also called the bootstrap method) means that you take a sample from the observed data. You subject this sample to the same clustering algorithm. Repeat many times. Then look at the intersections of the resulting clusters (or use what is called a consensus cluster). If the clusters are stable, the intersections will be large. We will look at this method in Chapter 15.
Another way of perturbing the data is by adding a little bit of noise. This should be a small fraction of the difference between the smallest and largest values, so it should not disturb the clusters too much. Items which move between clusters are not stable. Again, we sometimes repeat this method several times and then form a consensus cluster.

