9.2.9 - Connection between LDA and logistic regression
Under the model of LDA, we can compute the log-odds:
\[ \begin {align} & \text{log }\frac{Pr(G=k|X=x)}{Pr(G=K|X=x)}\\
& = \text{log }\frac{\pi_k}{\pi_K}-\frac{1}{2}(\mu_k+\mu_K)^T\Sigma^{-1}(\mu_k-\mu_K) \\
& = a_{k0}+a_{k}^{T}x \\
\end {align} \]
The model of LDA satisfies the assumption of the linear logistic model.
The difference between linear logistic regression and LDA is that the linear logistic model only specifies the conditional distribution \(Pr(G = k | X = x)\). No assumption is made about \(Pr(X)\); while the LDA model specifies the joint distribution of X and G. \(Pr(X)\) is a mixture of Gaussians:
\[Pr(X)=\sum_{k=1}^{K}\pi_k \phi (X; \mu_k, \Sigma) \]
where \(\phi\) is the Gaussian density function.
Moreover, linear logistic regression is solved by maximizing the conditional likelihood of G given X: \(Pr(G = k | X = x)\); while LDA maximizes the joint likelihood of G and X: \(Pr(X = x, G = k)\).
If the additional assumption made by LDA is appropriate, LDA tends to estimate the parameters more efficiently by using more information about the data.
Another advantage of LDA is that samples without class labels can be used under the model of LDA. On the other hand, LDA is not robust to gross outliers. Because logistic regression relies on fewer assumptions, it seems to be more robust to non-Gaussian type of data.
In practice, logistic regression and LDA often give similar results.
Simulated Example
Consider input X being 1-D.
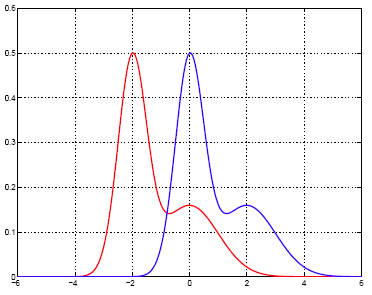
Two classes have equal priors and the class-conditional densities of X are shifted versions of each other, as shown in the plot below.
Each within-class density of X is a mixture of two normals:
- Class 1 (red): 0.6N(-2, ¼ ) + 0.4N(0, 1).
- Class 2 (blue): 0.6N(0, ¼ ) + 0.4N(2, 1).
The class-conditional densities are shown below.
LDA Result
Training data set: 2000 samples for each class.
Test data set: 1000 samples for each class.
The means and variance of the two classes estimated by LDA are:
\(\hat{\mu}_1\) = -1.1948,
\(\hat{\mu}_2\) = 0.8224,
\(\hat{\sigma}^2\) = 1.5268.
Boundary value between the two classes is \((\hat{\mu}_1 + \hat{\mu}_2) / 2 = -0.1862\).
The classification error rate on the test data is 0.2315.
Based on the true distribution, the Bayes (optimal) boundary value between the two classes is -0.7750 and the error rate is 0.1765.
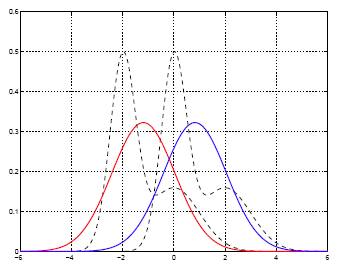
The estimated within-class densities by LDA are shown in the plot below. Both densities are Gaussian and are shifted version of each other, as assumed by LDA.
Logistic Regression Result
Linear logistic regression obtains:
\(\beta = (-0.3288, -1.3275)^T\).
The boundary value satisfies \(-0.3288 - 1.3275X = 0\), hence equals -0.2477.
The error rate on the test data set is 0.2205.
The estimated posterior probability is:
\[ Pr(G=1|X=x) =\frac{e^{- 0.3288-1.3275x}}{1+e^{- 0.3288-1.3275x}} \]
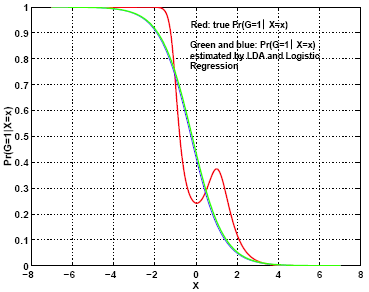
The estimated posterior probability, \(Pr(G =1 | X = x)\), and its true value based on the true distribution are compared in the graph below. We can see that although the Bayes classifier (theoretically optimal) is indeed a linear classifier (in 1-D, this means thresholding by a single value), the posterior probability of the class being 1 bears a form more complicated than the one implied by the logistic regression model. Under the logistic regression model, the posterior probability is a monotonic function of a specific shape, while the true posterior probability is not a monotonic function of x. The assumption made by the logistic regression model is more restrictive than a general linear boundary classifier.