Create a fitted line plot
The "fitted line plot" command is one way of obtaining the estimated regression function between a response y and a predictor x. The "fitted line plot" command provides not only the estimated regression function, but also a scatter plot of the data adorned with the estimated regression function.
 Minitab Procedure
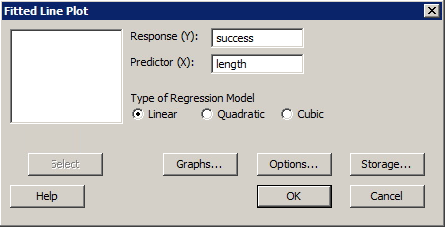
- Select Stat >> Regression >> Fitted Line Plot...
- In the box labeled "Response (Y)", specify the desired response variable.
- In the box labeled "Predictor (X)", specify the desired predictor variable.
- Select OK. A new window containing the fitted line plot will appear.
Example
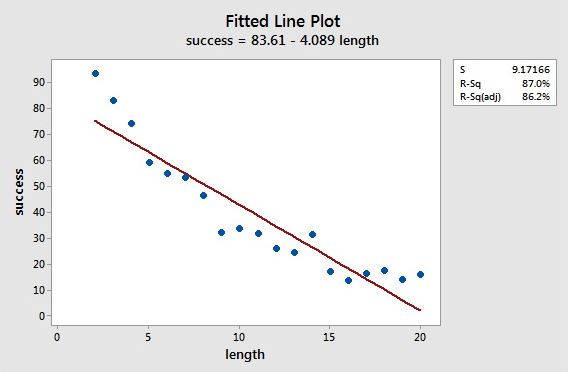
Sports Illustrated published results of a study designed to determine how well professional golfers putt. The data set puttgolf.txt contains data on the lengths of putts and the percentage of successful putts made by professional golfers during 15 tournaments. Only putts that were 2 to 20 feet from the hole are included in the data set.
What is the estimated linear relationship between y = success and x = length?
Fitted Line Plot ... dialog box
Sample output