Obtain a sample correlation
 Minitab Procedure
- Select Stat >> Basic statistics >> Correlation ...
- Specify the two (or more) variables for which you want the correlation coefficient(s) calculated.
- Pearson correlation is the default. An optional Spearman rho method is also available.
- If it isn't already checked, put a check mark in the box labeled Display p-values by clicking once on the box.
- Select OK. The output will appear in the session window.
Example
For people of the same age and gender, height is often considered a good predictor of weight. The data set htwtmales.txt contains the heights (ht, in cm) and weights (wt, in kg) of a sample of 14 males between the ages of 19 and 26 years.
- What is the sample correlation coefficient between ht and wt?
- Is there sufficient evidence to conclude that the population correlation coefficient between ht and wt is significantly different from 0?
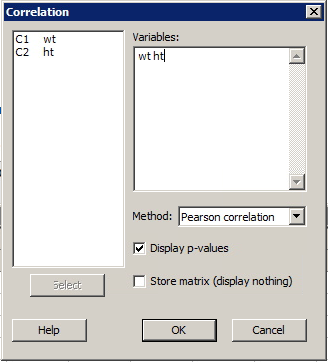
Minitab dialog box
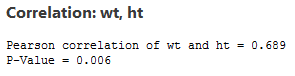
Resulting sample Minitab output