Find a confidence interval and a prediction interval for the response
 Minitab Procedure
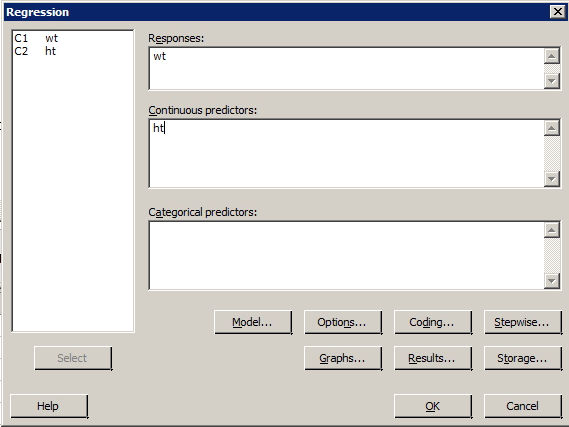
- Select Stat >> Regression >> Regression >> Fit Regression Model ...
- Specify the response and the predictor(s).
- Select OK. The output will appear in the session window.
Next, back up to the Main Menu having just run this regression:
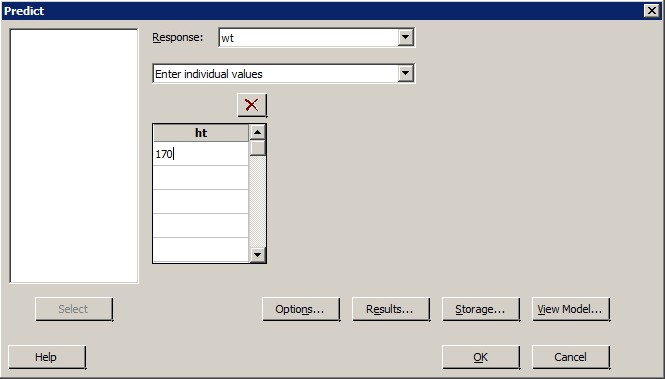
- Select Stat >> Regression >> Regression >> Predict ...
- Specify the response.
- Specify either the x value ("Enter individual values") or a column name ("Enter columns of values") containing multiple x values.
- Select Options... Specify the Confidence level — the default is 95%. Select OK.
- Select OK. The output will appear in the session window.
Example
For people of the same age and gender, height is often considered a good predictor of weight. The data set htwtmales.txt contains the heights (ht, in cm) and weights (wt, in kg) of a sample of 14 males between the ages of 19 and 26 years.
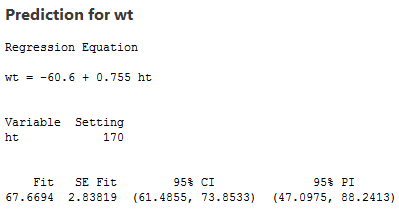
- Find a 95% prediction interval for the weight of a randomly selected male, aged 19 to 26, who is 170 centimeters tall.
- Find a 95% confidence interval for the average weight of all males, aged 19 to 26, who are 170 centimeters tall.
Minitab dialog boxes
Resulting Sample Minitab Output