Perform a linear regression analysis
 Minitab Procedures
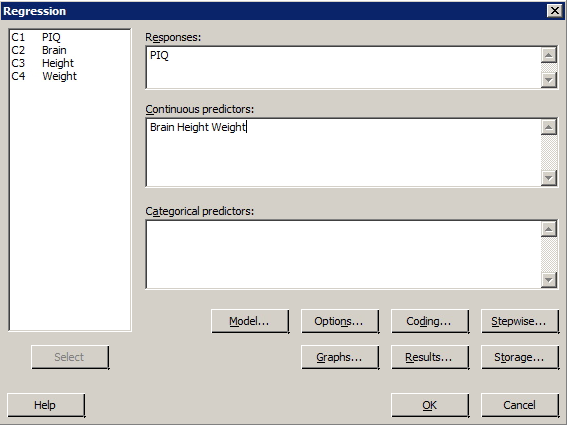
- Select Stat >> Regression >> Regression >> Fit Regression Model ...
- Specify the response and the predictor(s).
- (For standard residual plots) Under Graphs..., select the desired residual plots.
- Minitab automatically recognizes replicates of data and produces Lack of Fit test with Pure error by default.
- Select OK.
Next, back up to the Main Menu having just run this regression:
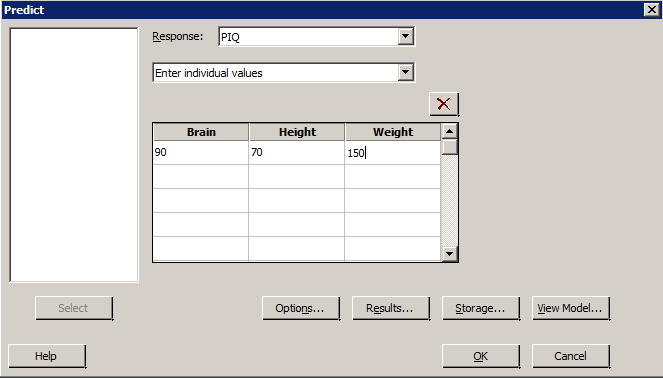
- (To get a prediction interval) Select Stat >> Regression >> Regression >> Predict ...
- Specify the response.
- Specify either the x value ("Enter individual values") or a column name ("Enter columns of values") containing multiple x values.
- Select Options... Specify the Confidence level — the default is 95%. Select OK.
- Select OK. The output will be displayed in the session window.
Regression Through the Origin
To fit an RTO model click "Model" and uncheck "Include the constant term in the model".
Example
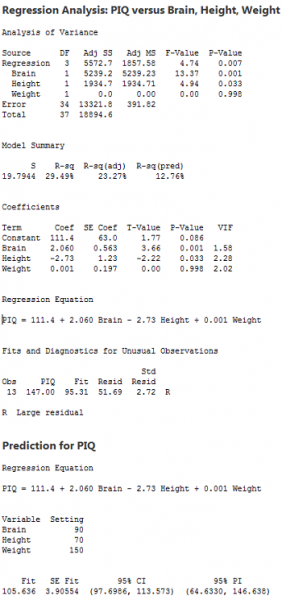
The iqsize.txt data set contains data on the IQ (y = PIQ), brain size (x1 = Brain), height (x2 = Height), and weight (x3 = Weight) of n = 38 college students. Fit the multiple linear regression model treating PIQ as the response, and Brain, Height, and Weight as the predictors. In doing so, request a lack of fit test. Also, with 95% confidence, predict the PIQ of a randomly selected college student whose Brain = 90, Height = 70 and Weight = 150.
Minitab Dialog Boxes
Resulting Minitab Output