Create a basic scatter plot
The basic "scatter plot" command creates a simple scatter plot of a response variable y against a predictor variable x.
 Minitab Procedure
- Select Graph >> Scatterplot ...
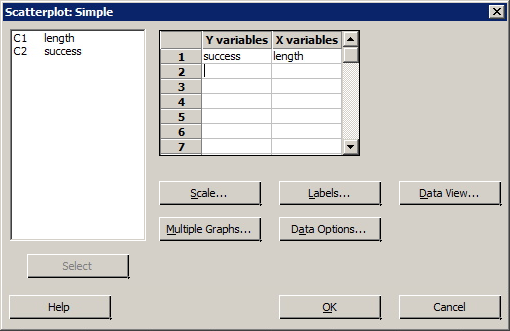
- Select the graph type "Simple."
- Specify your Y variable and your X variable in the boxes provided.
- Select OK. A new window containing the scatter plot will appear.
Example
Sports Illustrated published results of a study designed to determine how well professional golfers putt. The data set puttgolf.txt contains data on the lengths of putts and the percentage of successful putts made by professional golfers during 15 tournaments. Only putts that were 2 to 20 feet from the hole are included in the data set.
What is the plot of y = success and x = length suggest about the relationship between the two variables?
Minitab Plot dialog box
Minitab Sample plot


