In the last section we looked at the Example 11.2 which was in coded variables and was a central composite design.
In this section we examine a more general central composite design. For \(k = 2\) we had a \(2^2\) design with center points, which was required for our first order model; then we added \(2*k\) star points. The star or axial points are, in general, at some value \(\alpha\) and \({-\alpha}\) on each axis.
There are various choices of α. If \(\alpha = 1\), the star points would be right on the boundary, and we would just have a \(3^2\) design. Thus \(\alpha = 1\) is a special case, a case that we considered in the \(3^k\) designs. A more common choice of \(\alpha\) is \(\alpha =\sqrt{k}\) which gives us a spherical design as shown below.
Our \(2^2\) design gives us the box, and adding the axial points (in green) outside of the box gives us a spherical design where \(\alpha =\sqrt{k}\). The corner points and the axial points at \(\alpha\), are all points on the surface of a ball in three dimensions, as we see below.
This design in \(k = 3\) dimensions can also be referred to as a central composite design, chosen so that the design is spherical. This is a common design. Much of this detail is given in Table 11.11 of the text.
An alternative choice where \(\alpha = \left ( n_{F} \right )^{\frac{1}{4}}\), or the fourth root of the number of points in the factorial part of the design, gives us a rotatable design.
If we have k factors, then we have, \(2^k\) factorial points, \(2*k\) axial points and \(n_{c}\) center points. Below is a table that summarizes these designs and compares them to \(3^k\) designs:
| k = 2 | k = 3 | k = 4 | k = 5 | ||
|---|---|---|---|---|---|
| Central Composite Designs | Factorial points \(\mathbf{2^k}\) | 4 | 8 | 16 | 32 |
| Star points \(\mathbf{2^k}\) | 4 | 6 | 8 | 10 | |
| Center points \(\mathbf{n_c}\) (varies) | 5 | 5 | 6 | 6 | |
| Total | 13 | 19 | 30 | 48 | |
| \(\mathbf{3^k}\) Designs | 9 | 27 | 81 | 243 | |
| Choice of \(\alpha\) | Spherical design ( \(\mathbf{\alpha =\sqrt{k}}\) ) | 1.4 | 1.73 | 2 | 2.24 |
| Rotatable design ( \(\mathbf{\alpha = \left ( n_{F} \right )^{\frac{1}{4}}}\) ) | 1.4 | 1.68 | 2 | 2.38 | |
Compare the total number of observations required in the central composite designs versus the \(3^k\) designs. As the number of factors increases, you can see the efficiencies that are brought to bear.
The spherical designs are rotatable in the sense that the points are all equidistant from the center. Rotatable refers to the variance of the response function. A rotatable design exists when there is an equal prediction variance for all points a fixed distance from the center, 0. This is a nice property. If you pick the center of your design space and run your experiments, all points that are equal distance from the center in any direction, have an equal variance of prediction.
You can see in the table above that the difference in the variation between the spherical and rotatable designs are slight, and don't seem to make much difference. But both ideas provide justification for selecting how far away the star points should be from the center.
Why do we take about five or six center points in the design? The reason is also related to the variance of a predicted value. When fitting a response surface you want to estimate the response function in this design region where we are trying to find the optimum. We want the prediction to be reliable throughout the region, and especially near the center since we hope the optimum is in the central region. By picking five to six center points, the variance in the middle is approximately the same as the variance at the edge. If you only had one or two center points, then you would have less precision in the middle than you would have at the edge. As you go farther out beyond a distance of 1 in coded units, you get more variance and less precision. What we are trying to do is to balance the precision at the edge of the design relative to the middle.
How do you select the region where you want to run the experiment? Remember, for each factor X we said we need to choose the lower level is and the upper level for the region of experimentation. We usually picked the -1 and 1 as the boundary. If the lower natural unit is really the lowest number that you can test, because the experiment won't work lower than this, or the lower level is zero and you can't put in a negative amount of something, then, the star point is not possible because it is outside the range of experimentation.
If this is the case, one choice that you could make would be to use the \({-\alpha}\) as the lowest point. Generally, if you are not up against a boundary then this is not an issue and the star points are a way to reach beyond the region that you think the experiment should be run in. The issue isn't selecting the coding of the design relative to the natural units. You might lose some of these exact properties, but as long as you have the points nicely spread out in space you can fit a regression function. The penalty for not specifying the points exactly would be seen in the variance, and it would be actually very slight.
Minitab® – Generating These Designs in Minitab
Minitab will show you the available designs and how to generate these designs.
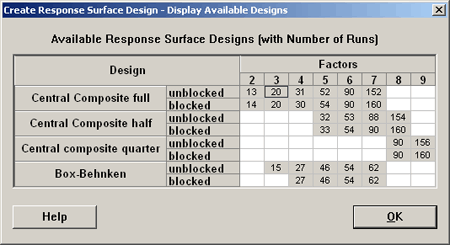
We can create central composite designs using a full factorial, central composite designs with fractional factorials, half fraction and a quarter fraction, and they can be arranged in blocks. Later, we will look at the Box-Behnken designs.
As an example, we look at the \(k=3\) design, set up in Minitab using a full factorial, completely randomized, in two blocks, or three blocks with six center points and the default \(\alpha = 1.633\) (or \(\alpha = 1.682\) for a rotatable design).
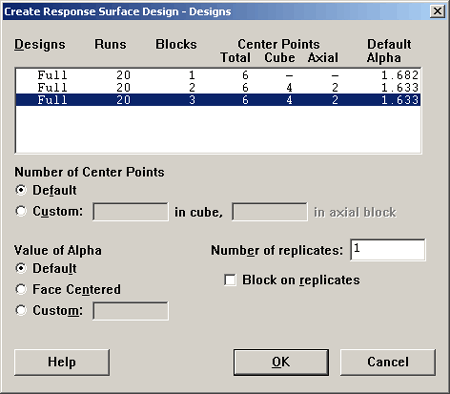
If you do not want the default \(\alpha\) you can specify your own in the lower left. A Face Centered design is obtained by putting the \(\alpha\) at +1 and -1 on the cube. Here is the design that results:
| Run | Blk | A | B | C |
|---|---|---|---|---|
| 1 | 1 | -1.000 | -1.000 | -1.000 |
| 2 | 1 | 1.000 | 1.000 | -1.000 |
| 3 | 1 | 1.000 | -1.000 | 1.000 |
| 4 | 1 | -1.000 | 1.000 | 1.000 |
| 5 | 1 | 0.000 | 0.000 | 0.000 |
| 6 | 1 | 0.000 | 0.000 | 0.000 |
| 7 | 2 | 1.000 | -1.000 | -1.000 |
| 8 | 2 | -1.000 | 1.000 | -1.000 |
| 9 | 2 | -1.000 | -1.000 | 1.000 |
| 10 | 2 | 1.000 | 1.000 | 1.000 |
| 11 | 2 | 0.000 | 0.000 | 0.000 |
| 12 | 2 | 0.000 | 0.000 | 0.000 |
| 13 | 3 | -1.633 | 0.000 | 0.000 |
| 14 | 3 | 1.633 | 0.000 | 0.000 |
| 15 | 3 | 0.000 | -1.633 | 0.000 |
| 16 | 3 | 0.000 | 1.633 | 0.000 |
| 17 | 3 | 0.000 | 0.000 | -1.633 |
| 18 | 3 | 0.000 | 0.000 | 1.633 |
| 19 | 3 | 0.000 | 0.000 | 0.000 |
| 20 | 3 | 0.000 | 0.000 | 0.000 |
The first block is a one half fraction of the \(2^3\) plus two center points. Block 2 is the second half fraction of the factorial part with two center points. The third block consists of six star points, plus to center points. Each of the three blocks contains two center points and the first two blocks have half of the corner points each. The third block contains the star points and is of size 8.
Rollover the words 'Block 1', 'Block 2', and 'Block 3' in the graphic above. Do you see how they use center points strategically to tie the blocks together? They are represented in each block and they keep the design connected.
The corner points all have +1 or -1 for every dimension, because they're at the corners. They are either up or down, in or out, right or left. The axial points have \(+\alpha\), or \(-\alpha\) \((+1.6330\ or -1.6330)\) for A, but are 0 for factors B and C. The center points have zero on all three axes, truly the center of this region. We have designed this to cover the space in just the right way so that we can estimate a quadratic equation. Using a Central Composite Design, we can't estimate cubic terms, and we can't estimate higher order interactions. If we had utilized a \(3^k\) design, one that quickly becomes unreasonably large, then we would have been able to estimate all of the higher order interactions.
However, we would have wasted a lot of resources to do it. The CCD allows us to estimate just linear and quadratic terms and first order interactions.
Example 11.1: Polymers and Elasticity Section
This example is from the Box and Draper (1987) book and the data from Tables 9.2 and 9.4 are in Minitab (BD9-1.csv).
This example has three variables and they are creating a polymer, a kind of plastic that has a quality of elasticity. The measurement in this experiment is the level of elasticity. We created the design in Minitab for this experiment, however the data only has two center points:
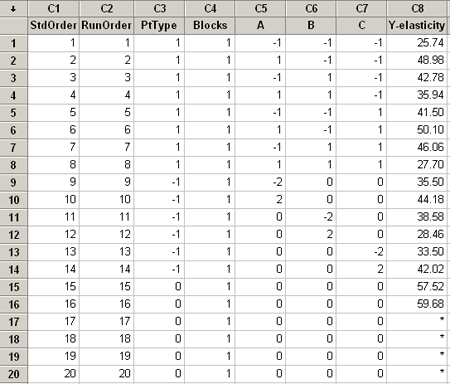
Variables A and B are the concentration of two ingredients that make up the polymer, and C is the temperature, and the response is elasticity. There are 8 corner points, a complete factorial, 6 star points and 2 center points.
Let's go right to the analysis stage now using Minitab ...
or you can view the condensed version with no audio...
Before we move on I would like to go back and take a look again at the plot of the residuals. Wait a minute! Is there something wrong with this residual plot?
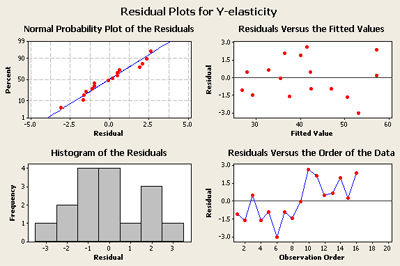
Residual plot for the polynomial fit
Look at the plot in the lower right. The first eight points tend to be low, and then the next eight points are at a higher level. This is a clue, that something is influencing the response that is not being fit by the model. This looks suspicious. What happened? My guess is that the experiment was run in two phases. They first ran the \(2^k\) part - (block 1). And then they noticed the response and added the star points to make a responsive surface design in the second part. This is often how these experiments are conducted. You first perform a first-order experiment, and then you add center points and star points and then fit the quadratic.
Add a block term and rerun the experiment to see if this makes a difference.
Two Types of Central Composite Designs Section
The central composite design has \(2*k\) star points on the axial lines outside of the box defined by the corner points. There are two major types of central composite designs: the spherical central composite design where the star points are the same distance from the center as the corner points, and the rotatable central composite design where the star points are shifted or placed such that the variances of the predicted values of the responses are all equal, for x’s which are an equal distance from the center.
When you are choosing, in the natural units, the values corresponding to the low and high, i.e. corresponding to -1 and 1 in coded units, keep in mind that the design will have to include points further from the center in all directions. You are trying to fit the design in the middle of your region of interest, the region where you expect the experiment to give the optimal response.