Example 11.3: Elongation of Yarn Section
Download: Ex11-3.mwx | Ex11-3.csv
This example has to do with the elongation of yarn based on its component fabrics. There are three components in this mixture and each component is a synthetic material. The mixture design was one that we had looked at previously. It is a simple lattice design of degree 2. This means that it has mixtures of 0, 1/2, 100%. The components of this design are made up of these three possibilities.
| StdOrder | RunOrder | PtType | Blocks | A | B | C | Y | |
|---|---|---|---|---|---|---|---|---|
| 1 | 1 | 1 | 1 | 1 | 1.0 | 0.0 | 0.0 | 11.0 |
| 2 | 2 | 2 | 2 | 1 | 0.5 | 0.5 | 0.0 | 15.0 |
| 3 | 3 | 3 | 2 | 1 | 0.5 | 0.0 | 0.5 | 17.7 |
| 4 | 4 | 4 | 1 | 1 | 0.0 | 1.0 | 0.0 | 8.8 |
| 5 | 5 | 5 | 2 | 1 | 0.0 | 0.5 | 0.5 | 10.0 |
| 6 | 6 | 6 | 1 | 1 | 0.0 | 0.0 | 1.0 | 16.8 |
| 7 | 7 | 7 | 1 | 1 | 1.0 | 0.0 | 0.0 | 12.4 |
| 8 | 8 | 8 | 2 | 1 | 0.5 | 0.5 | 0.0 | 14.8 |
| 9 | 9 | 9 | 2 | 1 | 0.5 | 0.0 | 0.5 | 16.4 |
| 10 | 10 | 10 | 1 | 1 | 0.0 | 1.0 | 0.0 | 10.0 |
| 11 | 11 | 11 | 2 | 1 | 0.0 | 0.5 | 0.5 | 9.7 |
| 12 | 12 | 12 | 1 | 1 | 0.0 | 0.0 | 1.0 | 16.0 |
| 13 | 13 | 13 | 1 | 1 | 1.0 | 0.0 | 0.0 | * |
| 14 | 14 | 14 | 2 | 1 | 0.5 | 0.5 | 0.0 | 16.1 |
| 15 | 15 | 15 | 2 | 1 | 0.5 | 0.0 | 0.5 | 16.6 |
| 16 | 16 | 16 | 1 | 1 | 0.0 | 1.0 | 0.0 | * |
| 17 | 17 | 17 | 2 | 1 | 0.0 | 0.5 | 0.5 | 11.8 |
| 18 | 18 | 18 | 1 | 1 | 0.0 | 0.0 | 1.0 | * |
In the Minitab program, the first 6 runs show you the pure components, and in addition, you have the 5 mixed components. All of this was replicated 3 times so that we have 15 runs. There were three that had missing data.
You can also specify in more detail which type of points that you want to include in the mixture design using the dialog boxes in Minitab if your experiment requires this.
Analysis
In the analysis we fit the quadratic model ( the linear + the interaction terms). Remember we only have 6 points in this design, the vertex, the half-lengths, so we are fitting a response surface to these 6 points. Let's take a look at the analysis:
Regression for Mixtures: Y versus A, B, C
Estimated Regression Coefficients for Y (component proportions)
| Term | Coef | SE Coef | T | P | VIF |
|---|---|---|---|---|---|
| A | 11.70 | 0.6037 | * | * | 1.750 |
| B | 9.400 | 0.6037 | * | * | 1.750 |
| C | 16.400 | 0.637 | * | * | 1.750 |
| A*B | 19.000 | 2.6082 | 7.28 | 0.000 | 1.750 |
| A*C | 11.400 | 2.6082 | 4.37 | 0.002 | 1.750 |
| B*C | -9.600 | 2.6082 | -3.68 | 0.005 | 1.750 |
| S = 0.853750 | PRESS = 18.295 | |
| R-Sq = 95.14% | R- Sq(pred) = 86.43% | R-Sq(adj) = 92.43% |
Analysis of variance for Y (component proportions)
| Source | DF | Seq SS | Adj SS | Adj MS | F | P |
|---|---|---|---|---|---|---|
| Regression | 5 | 128.296 | 128.2960 | 25.6592 | 35.20 | 0.000 |
| Linear | 2 | 57.629 | 50.9200 | 25.4600 | 34.93 | 0.000 |
| Quadratic | 3 | 70.667 | 70.669 | 23.5556 | 32.32 | 0.000 |
| Residual Error | 9 | 6.560 | 6.5600 | 0.7289 | ||
| Total | 14 | 134.856 |
Here we get 2 df linear, 3 df quaratic, these are the five regression parameters. If you look at the individual coefficients, six of them because they are is no intercept, three linear and three cross-product terms... The 9 df for error are from the triple replicates and the double replicates. This is pure error and there is no additional df for lack of fit in this full model.
If we look at the coutour service plot we get:
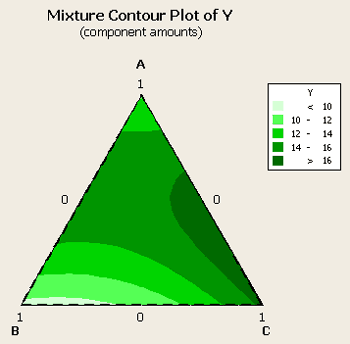
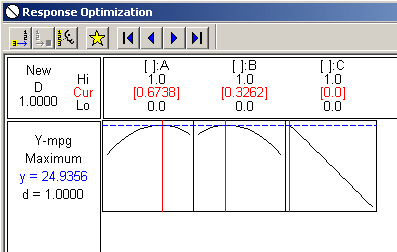
We have the optimum somewhere between a mixture of A and C, with B essentially not contributing very much at all. So, roughly 2/3rds C and 1/3 A is what we would like in our mixture. Let's look at the optimizer to find the optimum values.
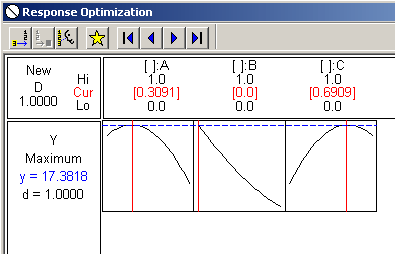
It looks like A = about .3 and B = about .7, with B not contributing nothing to the mixture.
Unless I see the plot how can I use the analysis output? How else can I determine the appropriate levels?
Example 11.4: Gasoline Production Section
Pr11-31.MTW from text
This example focuses on the production of an efficient gasoline mixture. The response variable is miles per gallon (mpg) as a function of the 3 components in the mixture. The data set contains these 14 points - which has duplicates at the centroid, labeled (1/3, 1/3, 1/3), and the three vertices, labeled (1,0,0), (0,1,0), and (0,0,1).
| StdOrder | RunOrder | PtType | Blocks | A | B | C | Y-mpg | |
|---|---|---|---|---|---|---|---|---|
| 1 | 1 | 1 | 1 | 1 | 1.00000 | 0.00000 | 0.00000 | 24.5 |
| 2 | 2 | 2 | 2 | 1 | 0.50000 | 0.50000 | 0.00000 | 25.1 |
| 3 | 3 | 3 | 2 | 1 | 0.50000 | 0.00000 | 0.50000 | 24.3 |
| 4 | 4 | 4 | 1 | 1 | 0.00000 | 1.00000 | 0.00000 | 24.8 |
| 5 | 5 | 5 | 2 | 1 | 0.00000 | 0.50000 | 0.50000 | 23.5 |
| 6 | 6 | 6 | 1 | 1 | 0.00000 | 0.00000 | 1.00000 | 22.7 |
| 7 | 7 | 7 | 0 | 1 | 0.33333 | 0.33333 | 0.33333 | 24.8 |
| 8 | 8 | 8 | -1 | 1 | 0.66667 | 0.16667 | 0.16667 | 24.2 |
| 9 | 9 | 9 | -1 | 1 | 0.16667 | 0.66667 | 0.16667 | 23.7 |
| 10 | 10 | 10 | -1 | 1 | 0.16667 | 0.16667 | 0.66667 | 23.7 |
| 11 | 11 | 11 | 1 | 1 | 1.00000 | 0.00000 | 0.00000 | 25.1 |
| 12 | 12 | 12 | 1 | 1 | 0.00000 | 1.00000 | 0.00000 | 23.9 |
| 13 | 13 | 13 | 1 | 1 | 0.00000 | 0.00000 | 1.00000 | 23.6 |
| 14 | 14 | 14 | 0 | 1 | 0.33333 | 0.33333 | 0.33333 | 24.1 |
This is a degree 2 design that has points at the vertices, middle of the edges, the center, and axial points, which are interior points, (2/3, 1/6, 1/6), (1/6, 2/3, 1/6) and (1/6, 1/6, 2/3). Also the design includes replication at the vertices and the centroid.
If you analyze this dataset without having first generated the design in Minitab, you need to tell Minitab some things about the data since you're importing it.
Analysis of variance for Y-mpg (component proportions)
| Source | DF | Seq SS | Adj SS | Adj MS | F | P |
|---|---|---|---|---|---|---|
| Regression | 5 | 4.2224 | 4.2224 | 0.84449 | 3.90 | 0.043 |
| Linear | 2 | 3.9247 | 2.7487 | 1.37433 | 6.35 | 0.022 |
| Quadratic | 3 | 0.2978 | 0.2978 | 0.09925 | 0.46 | 0.719 |
| Residual Error | 8 | 1.7319 | 1.7319 | 0.21648 | ||
| Lack-of-Fit | 4 | 0.4969 | 0.4969 | 0.12421 | 0.40 | 0.800 |
| Pure Error | 4 | 1.2350 | 1.2350 | 0.30875 | ||
| Total | 13 | 5.9543 |
The model shows a linear term significant, the quadratic terms not significant, and the lack of fit, ( a total of 10 points and we are fitting a model sex parameters - 4 df), it shows that there is no lack of fit from the model. It is not likely that it would make any difference.
If we look at the contour plot for this data:
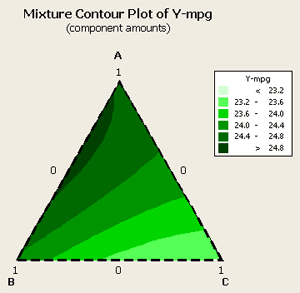
We can see that the optimum looks to be about 1/3, 2/3 between components A and B. Component C does not play hardly any role at all. Next, let's look at the optimizer for this data where we want to maximize a target of about 24.9.
And, again, we can see that component A at the optimal level is about 2/3rds and component B is at about 1/3rd. Component C plays no part, as a matter of fact if we were to add it to the gasoline mixture it would probably lower our miles per gallon average.
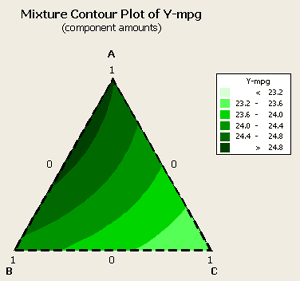
Let's go back to the model and take out the factors related to component C and see what happens. When this occurs we get the following contour plot...
... and the following analysis:
Analysis of variance for Y-mpg (component proportions)
| Source | DF | Seq SS | Adj SS | Adj MS | F | P |
|---|---|---|---|---|---|---|
| Regression | 3 | 4.0812 | 4.0812 | 1.3604 | 7.26 | 0.007 |
| Linear | 2 | 3.9247 | 3.1548 | 1.5774 | 8.42 | 0.007 |
| Quadratic | 1 | 0.1566 | 0.1566 | 0.1566 | 0.84 | 0.382 |
| Residual Error | 10 | 18731 | 18731 | 0.1873 | ||
| Lack-of-Fit | 6 | 0.6381 | 0.6381 | 0.1063 | 0.34 | 0.882 |
| Pure Error | 4 | 1.2350 | 1.2350 | 0.3088 | ||
| Total | 13 | 5.9543 |
Our linear terms are still significant, our lack of fit is still not significant. the analysis is saying that linear is adequate for this situation and this set of data.
One says 1 ingredient and the other says a blend - which one should we use?
I would like look at the variance. ...
24.9 is the predicted value.
By having a smaller, more parimonious model you decrease the variance. This is what you would expect with a model with fewer parameters. The standard error of the fit is a function of the design, and for this reason, the fewer the parameters the smaller the variance. But is also a function of residual error which gets smaller as we throw out terms that were not significant.