Populations and Parameters Section
- Population
- any large collection of objects or individuals, such as Americans, students, or trees about which information is desired
- Parameter
- any summary number, like an average or percentage, that describes the entire population
The population mean $\mu$ (the Greek letter "mu") and the population proportion $p$ are two different population parameters. For example:
- We might be interested in learning about the average weight of all middle-aged female Americans. The population consists of all middle-aged female Americans, and the parameter is $\mu$.
- Or, we might be interested in learning about the proportion of likely American voters approving of the president's job performance. The population comprises all likely American voters, and the parameter is $p$.
The problem is that almost all of the time, we don't — or can't — know the real value of a population parameter. The best we can do is estimate the parameter! This is where samples and statistics come in to play.
Samples and Statistics Section
- Sample
- is a representative group drawn from the population
- Statistic
- any summary number, like an average or percentage, that describes the sample
The sample mean, $\bar{X}$, and the sample proportion, $\hat{p}$, are two different sample statistics. For example:
- We might use $\bar{x}$, the average weight of a random sample of 100 middle-aged female Americans, to estimate $\mu$, the average weight of all middle-aged female Americans.
- Or, we might use $\hat{p}$, the proportion in a random sample of 1000 likely American voters who approve of the president's job performance, to estimate $p$, the proportion of all likely American voters who approve of the president's job performance.
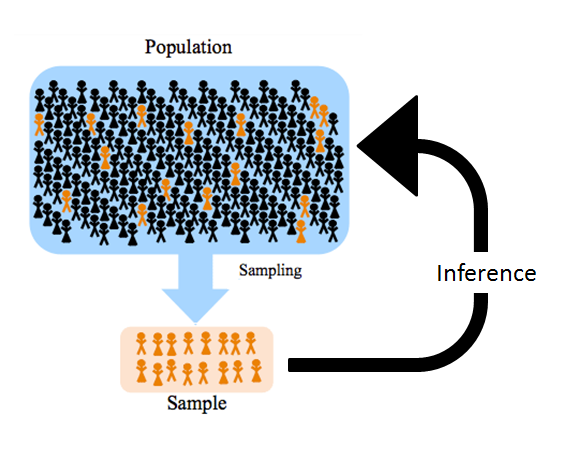
Because samples are manageable in size, we can determine the actual value of any statistic. We use the known value of the sample statistic to learn about the unknown value of the population parameter.
Techniques of describing data in ways to capture the essence of the information in the data are called descriptive statistics. For example, the sample mean is a descriptive statistic. To draw conclusions from data about the population is called inferential statistics. Here is a picture that demonstrates inferential statistics.

