
Introduction Section
So far, the methods we learned were for the population mean. The mean is a good measure of center when the data is bell-shaped, but it is sensitive to outliers and extreme values. When the data is skewed, however, a better measure of center would be the median. The median, you may recall, is a resistant measure. We present an example below that demonstrates why we might consider an alternative method than the one presented so far. In other words, we may want to consider a test for the median and not the mean.
Example 11.1: Tax Forms Section
The Internal Revenue Service (IRS) claims that it should typically take about 160 minutes to fill out a 1040 tax form. A researcher believes that the IRS's claim is not correct and that it generally takes people longer to complete the form. He recorded the time (in minutes) it took 30 individuals to complete the form. Download the data set: [irs.txt]
How would we approach this using previous methods? We would set the hypotheses as:
\(H_0\colon \mu=160\)
\( H_a\colon \mu>160\)
If we run the analysis in Minitab, we get the following output:
Descriptive Statistics
| N | Mean | StDev | SE Mean | 95% Lower Bound for μ |
|
30 |
209.40 | 159.15 | 29.06 | 160.03 |
μ: mean of time
Test
Alternative hypothesis
H1: μ > 160
| T-Value | P-Value |
|---|---|
| 1.70 | 0.0499 |
The output here gives the \(t\) statistic (1.7001), the degrees of freedom (29) and the p-value (0.04991). In this case, the p-value is less than our significance level, \(\alpha=0.05\). Therefore we reject the null hypothesis and conclude that it takes on average longer than 160 to complete the 1040 form.
We assumed time to fill out the form was Normally distributed (or at least symmetric) BUT time is not Normally distributed (symmetric). It is generally skewed with a long right tail. Let’s take a look at the data. Below is the histogram of the data.
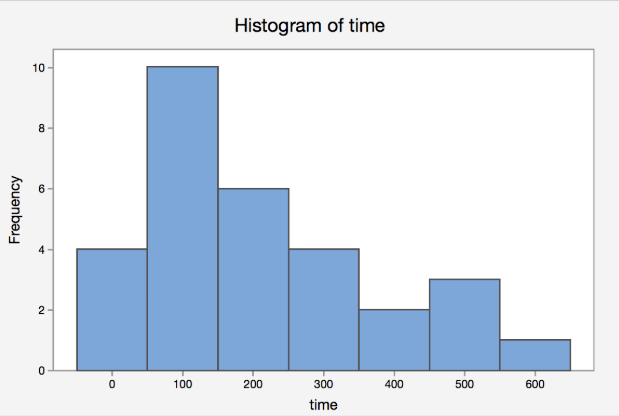
As you can see from the histogram, the shape of the data does not support the assumption that time is Normally distributed. There is a clear right tail here. In a skewed distribution, the population median, typically denoted as \(\eta\), is a better typical value than the population mean, \(\mu\).