Minitab® – Using Minitab to Construct Pie and Bar Charts
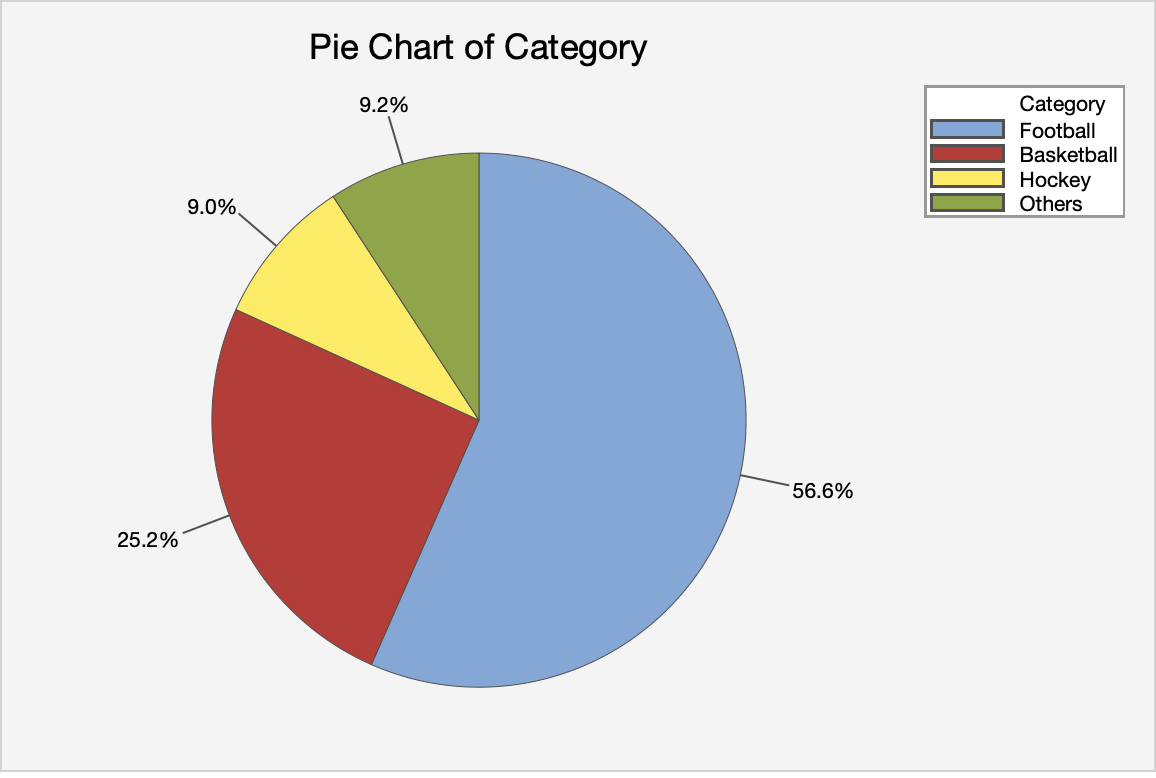
Steps for Creating a Pie Chart
- In Minitab choose Graph> Pie Chart.
- Choose one of the following, depending on the format of your data:
- In Category names, enter the column of categorical data that defines the groups.
- In Summary values, enter the column of summary data that you want to graph.
- Choose OK.
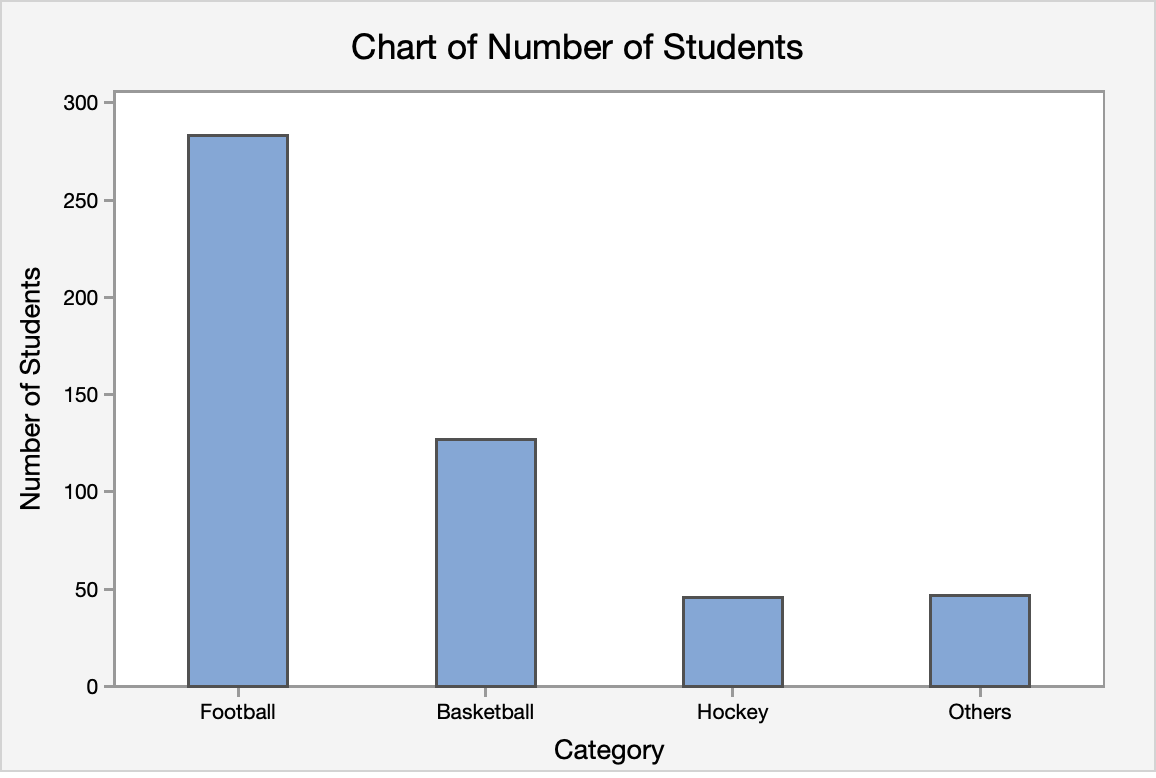
Steps for Creating a Bar Chart
- In Minitab choose Graph> Bar Chart.
- Choose one of the following, depending on the format of your data:
- Counts of unique values (This is the best option). Choose Simple for the graph type.
- A function of a variable
- Values from a table
- Choose OK.
Try It! Section
One survey of 500 Penn State University students about their favorite sport to watch shows that 283 said Football, 126 said Basketball, 45 said Hockey, 46 said Others. Practice with Minitab to create a pie chart and bar chart for favorite sport.