
Let's use the following example to look at the logic behind what an analysis of variance is after.
Application: Tar Content Comparisons Section
We want to see whether the tar contents (in milligrams) for three different brands of cigarettes are different. Two different labs took samples, Lab Precise and Lab Sloppy.
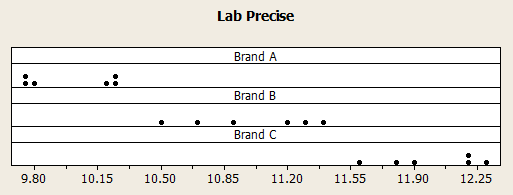
Lab Precise
Lab Precise took six samples from each of the three brands and got the following measurements:
| Sample | Brand A | Brand B | Brand C |
|---|---|---|---|
| 1 | 10.21 | 11.32 | 11.60 |
| 2 | 10.25 | 11.20 | 11.90 |
| 3 | 10.24 | 11.40 | 11.80 |
| 4 | 9.80 | 10.50 | 12.30 |
| 5 | 9.77 | 10.68 | 12.20 |
| 6 | 9.73 | 10.90 | 12.20 |
| Average | \(\bar{y}_1= 10.00\) | \(\bar{y}_2= 11.00\) | \(\bar{y}_3= 12.00\) |
Lab Precise Dotplot
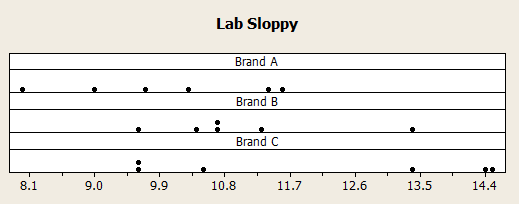
Lab Sloppy
Lab Sloppy also took six samples from each of the three brands and got the following measurements:
| Sample | Brand A | Brand B | Brand C |
|---|---|---|---|
| 1 | 9.03 | 9.56 | 10.45 |
| 2 | 10.26 | 13.40 | 9.64 |
| 3 | 11.60 | 10.68 | 9.59 |
| 4 | 11.40 | 11.32 | 13.40 |
| 5 | 8.01 | 10.68 | 14.50 |
| 6 | 9.70 | 10.36 | 14.42 |
| Average | \(\bar{y}_1= 10.00\) | \(\bar{y}_2= 11.00\) | \(\bar{y}_3= 12.00\) |
Lab Sloppy Dotplot
The sample means from the two labs turned out to be the same and thus the differences in the sample means from the two labs are zero.
From which data set can you draw more conclusive evidence that the means from the three populations are different?
We need to compare the between-sample-variation to the within-sample-variation. Since the between-sample-variation from Lab Sloppy is large compared to the within-sample-variation for data from Lab Precise, we will be more inclined to conclude that the three population means are different using the data from Lab Precise. Since such analysis is based on the analysis of variances for the data set, we call this statistical method the Analysis of Variance (or ANOVA).