
If the interest is to investigate the relationship between two quantitative variables, one valuable tool is the scatterplot.
- Scatterplot
- A graphical representation of two quantitative variables where the explanatory variable is on the x-axis and the response variable is on the y-axis.
When we look at the scatterplot, keep in mind the following questions:
- What is the direction of the relationship?
- Is the relationship linear or nonlinear?
- Is the relationship weak, moderate, or strong?
- Are there any outliers or extreme values?
We describe the direction of the relationship as positive or negative. A positive relationship means that as the value of the explanatory variable increases, the value of the response variable increases, in general. A negative relationship implies that as the value of the explanatory variable increases, the value of the response variable tends to decrease.
Example 9-1: Student height and weight (Scatterplots) Section
Suppose we took a sample from students at a large university and asked them about their height and weight. The data can be found here university_ht_wt.txt.
The first three observations are:
|
Height (inches) |
Weight (pounds) |
|---|---|
|
72 |
200 |
|
68 |
165 |
|
69 |
160 |
We let \(X\) denote the height and \(Y\) denote the weight of the student. The observations are then considered as coordinates \((x,y)\). For example, student 1 has coordinate (72,200). These coordinates are plotted on the x-y plane.
We can use Minitab to create the scatterplot.
Minitab: Scatterplots
We can create our scatterplot in Minitab following these steps.
- Choose Graph > Scatterplot > Simple
- Choose OK
Scatterplot of Weight vs Height
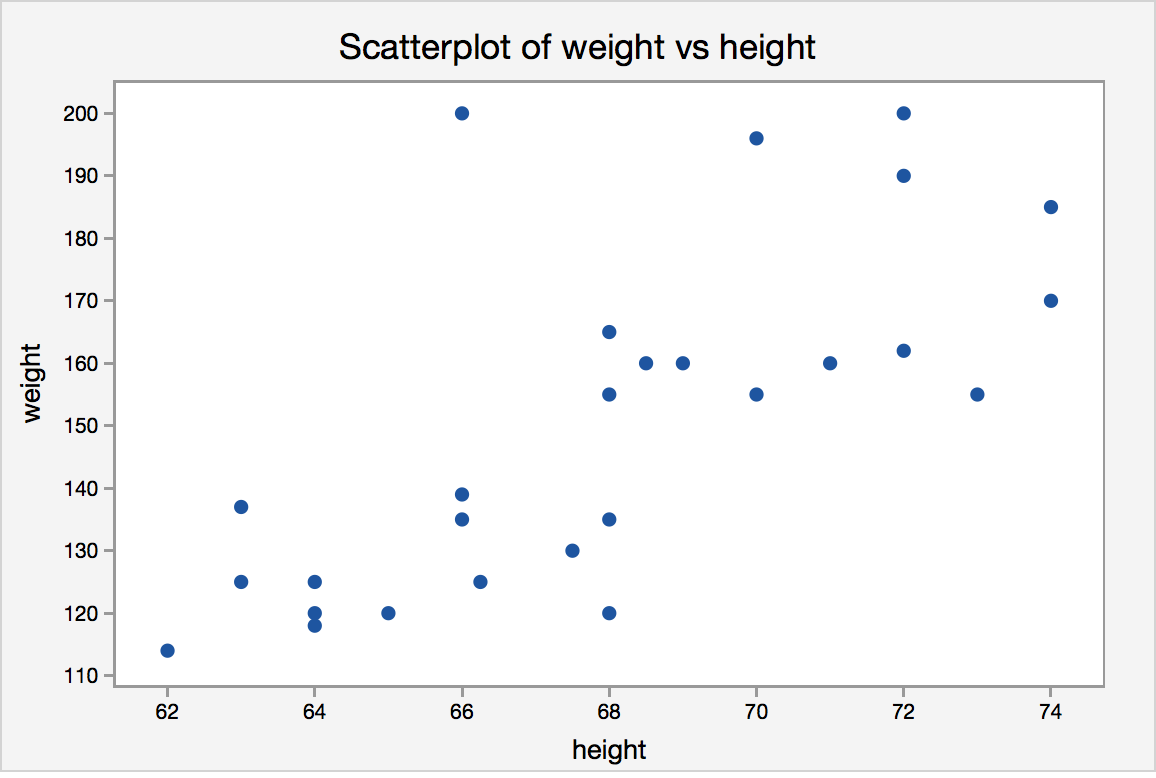
The scatterplot shows that, in general, as height increases, weight increases. We say “in general” because it is not always the case. For example, the observation with a height of 66 inches and a weight of 200 pounds does not seem to follow the trend of the data.
The two variables seem to have a positive relationship. As the height increases, weight tends to increase as well. The relationship does not seem to be perfectly linear, i.e., the points do not fall on a straight line, but it does seem to follow a straight line moderately, with some variability.
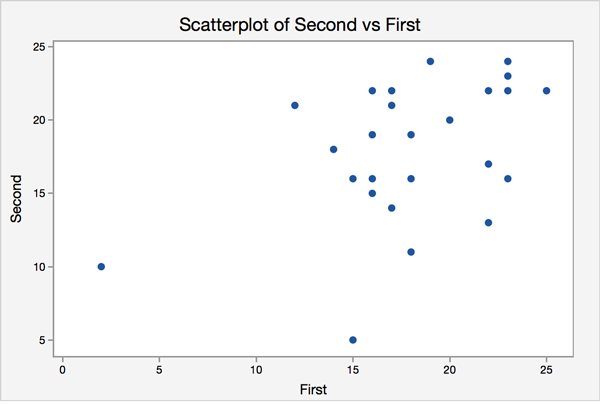
Try it! Section
An elementary school teacher gives her students two spelling tests a year. Each test contains 24 words, and the score is the number of words spelled correctly. The teacher is interested in the relationship between the score on the first test and the score on the second test. Using the scatterplot, comment on the relationship between the two variables.
In the next section, we will introduce correlation. Correlation is a measure that gives us an idea of the strength and direction of the linear relationship between two quantitative variables.