
Using Normal Probability Plot to Check Normality Section
If the sample size is less than 30, one needs to use a Normal Probability Plot to check whether the assumption that the data come from a normal distribution is valid.
- Normal Probability Plot
- The Normal Probability Plot is a graph that allows us to assess whether or not the data comes from a normal distribution.
Example 5-7: Rattlesnake Lengths Section
It is very time consuming to find rattlesnakes and nerve racking to measure them (for obvious reasons). A scientist randomly finds 12 snakes from the central Pennsylvania area and measures their length. The following twelve measurements in inches are obtained:
40.2, 43.1, 45.5, 44.5, 39.5, 38.5, 40.2, 41.0, 41.6, 43.1, 44.9, 42.8
Using the above data, find a 90% confidence interval for the mean length of rattlesnakes in the central Pennsylvania area.
Step 1 Check Conditions
Think about what conditions you need to check. The sample size is only 12. The scenario does not give us an indication that the lengths follow a normal distribution. Therefore, let's do a normal probability plot to check whether the assumption that the data come from a normal distribution is valid.
Minitab: Creating a normal probability plot
To create a normal probability plot in Minitab:
- Enter the 12 measurements into one column (name it length for this example) or upload the snakes.txt file.
- Type or upload the data in the first column in Minitab.
- Choose Graph > Probability Plot
Here is the normal probability plot for the rattlesnake data. What do you conclude about whether they may come from a normal distribution?
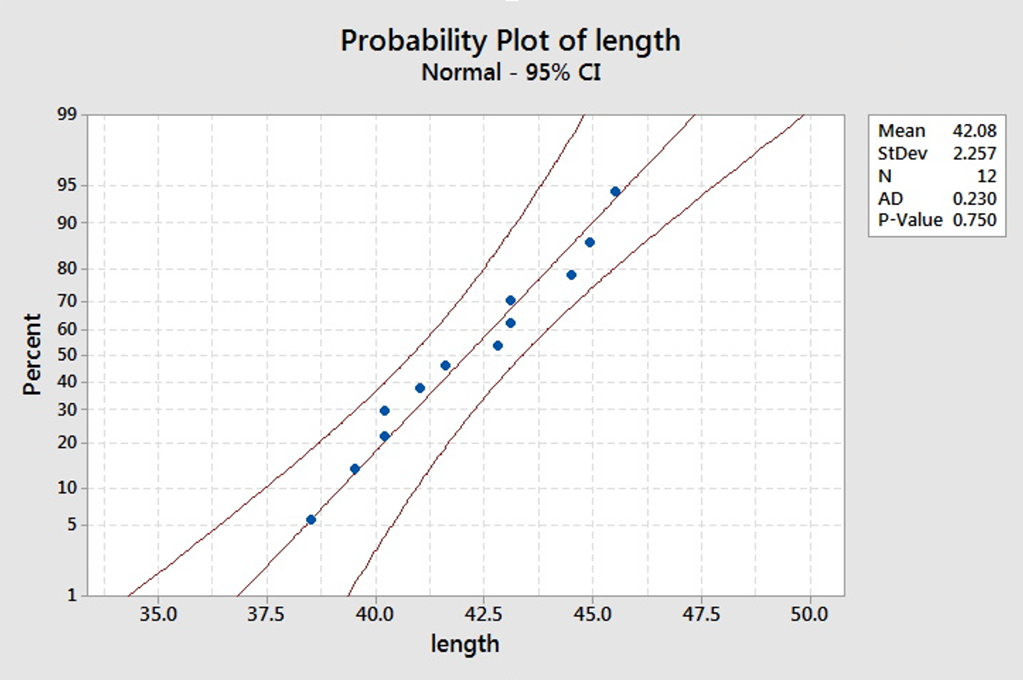
Since the points all fall within the confidence limits, it is reasonable to suggest that the data come from a normal distribution.
Step 2 Construct the CI
Now, we can proceed to find the 90% t-interval for the mean length of rattlesnakes in the central Pennsylvania area since even though the sample size is less than 30, the normality plot shows that the data may come from a normal distribution.
Minitab: Find the t-interval using Minitab
- Enter the 12 measurements into one column (name it length for this example)
- Choose Stat > Basic Statistics > 1-Sample t
- Click on the variable (length for this example) and change to the desired confidence level
The Minitab output will provide the confidence interval. We get the following:
| N | Mean | StDev | SE Mean | 90% CI |
|---|---|---|---|---|
| 12 | 42.075 | 2.257 | 0.652 | (40.905, 43.245) |
View the video to see these steps within Minitab.
Video: Minitab: 90% Confidence Interval for Continuous Data in Minitab
Step 3 Interpret the Interval
We are 90% confident that the population mean lengths of rattlesnakes is between 40.905 and 43.245 inches.