
As previously mentioned, setting up the hypotheses is the most important step. In this section, we provide some additional practice with examples where we do not indicate explicitly if it is a test for a mean or a proportion.
Try it!
Checkout Time Section
Fresh N Friendly food store advertises that their checkout waiting times is four minutes or less. An angry customer wants to dispute this claim. He takes a random sample of shoppers at the peak time and records their checkout times. Can he dispute their claim at significance level 10%?
Checkout times:
3.8, 5.3, 3.5, 4.5, 7.2, 5.1
- Step 1: Set up the hypotheses and check conditions.
-
The response variable is waiting time and is quantitative. Therefore, the hypotheses should be in terms of the population mean.
\( H_0\colon \mu=4 \) vs \(H_a\colon \mu>4 \)
The sample size is small, \(n=6 \). There is also no indication in the problem that the waiting times follow a normal distribution. We can use the Normal Probability Plot to examine the data.
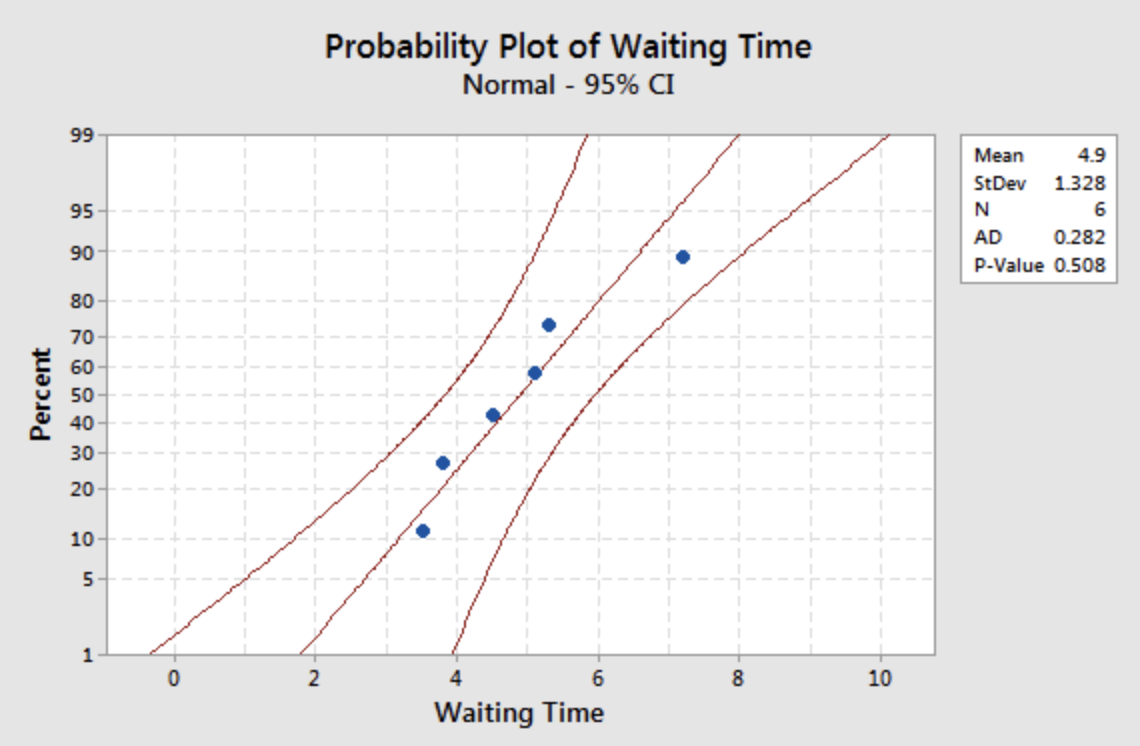
The data seem consistent with the Normal distribution and therefore it seems reasonable that the data come from a Normal distribution. We should use caution here, however. If the data do not come from a Normal distribution, the conclusion is not valid.
- Step 2: Decide on the significance level, \(\alpha \).
- The problem suggests that we use \(\alpha=0.10 \) .
- Step 3: Calculate the test statistic:
- In order to do so, we must first calculate the sample mean and sample standard deviation. The sample mean is \(\bar{x}=4.9 \) and \(s=1.3282 \). The test statistic is:
\begin{align} \text{t}^*&=\dfrac{\bar{x}-\mu_0}{\frac{s}{\sqrt{n}}}\\&=\dfrac{4.9-4}{\frac{1.3282}{\sqrt{6}}}\\&=1.6598 \end{align}
- Step 4: Compute the appropriate p-value based on our alternative hypothesis.(p-value approach)
- For this example, we will find the p-value. For extra practice, find the rejection region on your own. \begin{align} \text{p-value}&=P(T>t^*)\\&=P(T>1.6598)\\&=1-0.9211\\&=0.0789 \end{align} Where T is a t-distribution with \(n-1=6-1=5 \) degrees of freedom.
- Step 5: Make a decision about the null hypothesis.
- Since our p-value of 0.0789 is less than our significance level of 10%, we reject the null hypothesis.
- Step 6: State an overall conclusion.
- At 10% significance, we have enough evidence in the data to dispute the store’s claim that the mean waiting time is less than four minutes.
Try it!
Satisfaction Surveys Section
The CEO of a large computer company claims that 80 percent of his customers are “very satisfied” with the customer service they receive. To test this claim, the researcher surveyed 100 customers and 75 of them stated they are “very satisfied.” Based on these findings, can we reject the CEO's hypothesis that 80% of the customers are very satisfied?
- Step 1: Set up the hypotheses and check conditions.
-
The response is categorical so the hypotheses will be based on the population proportion. The claim, or the null, will be that the proportion is 0.8 and the alternative is that it is different than 0.8. In symbols we have:
\( H_0\colon p=0.8 \) vs \(H_a\colon p\ne 0.8 \)
The conditions, \(np_0=100(0.8) \) and \(n(1-p_0)=100(1-0.8) \) are both greater than five. Therefore, we can continue with the one proportion Z-test.
- Step 2: Decide on the significance level, \(\alpha \).
- The level of significance is not stated in the problem. If it is not stated, we typically assume it to be 5%.
- Step 3: Calculate the test statistic.
- The test statistic is:
\begin{align} \text{z}^*&=\dfrac{\hat{p}-p_0}{\sqrt{\frac{p_0(1-p_0)}{n}}}\\&=\dfrac{\frac{75}{100}-0.8}{\sqrt{\frac{0.8(1-0.8)}{100}}}\\&=-1.25 \end{align}
- Step 4: Compute the appropriate p-value based on our alternative hypothesis.(p-value approach).
- For this example we will use the p-value approach. You may want to find the critical value and rejection region for extra practice. \begin{align} \text{p-value}&=2P(Z>|z^*|)\\&=2P(Z>1.25)\\&=2(0.1056)\\&=0.2112 \end{align}
- Step 5: Make a decision about the null hypothesis.
- Since our p-value is greater than our significance level, we fail to reject the null hypothesis.
- Step 6: State an overall conclusion.
- At significance level of 5%, there is not enough evidence in the data to suggest the population proportion of customers who are “very satisfied” is not equal to 80%.
Try it!
Hotel Survey Section
There is a claim that about 10% of all men traveling on business bring a friend or a spouse. According to a survey by Rest Easy Hotel, 5% of the 40 men who are traveling for business purposes brought a friend or spouse. Can Rest Easy Hotel dispute this claim and conclude that it is not 10%?
- Step 1: Set up the hypotheses and check conditions.
-
The response variable is categorical (bring spouse or not). Our hypotheses will be based on the population proportion.
\(H_0\colon p=0.10 \text{ vs } H_a\colon p\ne0.1\)
Before we proceed, we need to check our conditions. We need \(np_0>5\) and \(n(1-p_0)>5\) and in this case we have \(40(0.10)=4\) and \(40(0.9)=36\).
- Since out conditions are not satisfied, we should not proceed with the Z-test for one proportion. It would be best to continue exact methods. We leave out how to do this.