In each case, we'll illustrate how to perform the hypothesis tests of this lesson using summarized data.
Hypothesis Test for One Variance Section
-
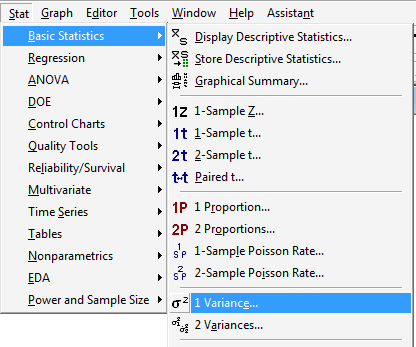
Under the Stat menu, select Basic Statistics, and then select 1 Variance...:
-
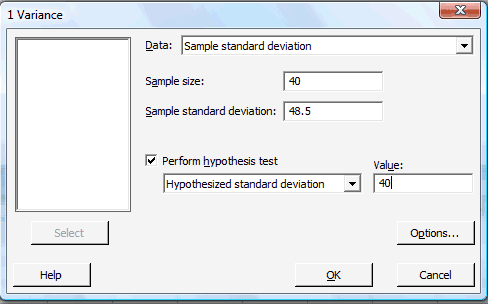
In the pop-up window that appears, in the box labeled Data, select Sample standard deviation (or alternatively Sample variance). In the box labeled Sample size, type in the size n of the sample. In the box labeled Sample standard deviation, type in the sample standard deviation. Click on the box labeled Perform hypothesis test, and in the box labeled Value, type in the Hypothesized standard deviation (or alternatively the Hypothesized variance):
-
Click on the button labeled Options... In the pop-up window that appears, for the box labeled Alternative, select either less than, greater than, or not equal depending on the direction of the alternative hypothesis:
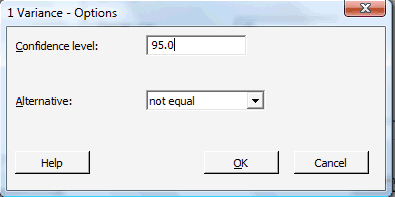
Then, click on OK to return to the main pop-up window.
-
Then, upon clicking OK on the main pop-up window, the output should appear in the Session window:
95% Confidence Intervals
TestsMethod CI for
StDevCI for
VarianceChi-Square (39.7, 62.3) (1578, 3878) Method Test
StatisticDF P-Value Chi-Square 57.34 39 0.059
Hypothesis Test for Two Variances Section
-
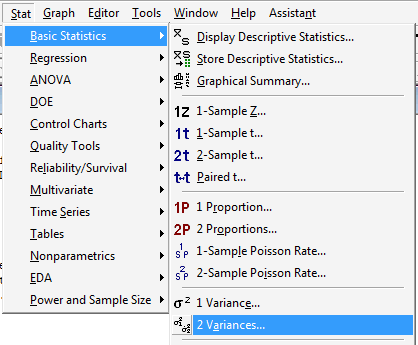
Under the Stat menu, select Basic Statistics, and then select 2 Variances...:
-
In the pop-up window that appears, in the box labeled Data, select Sample standard deviations (or alternatively Sample variances). In the box labeled Sample size, type in the size n of the First sample and m of the Second sample. In the box labeled Standard deviation, type in the sample standard deviations for the First and Second samples:
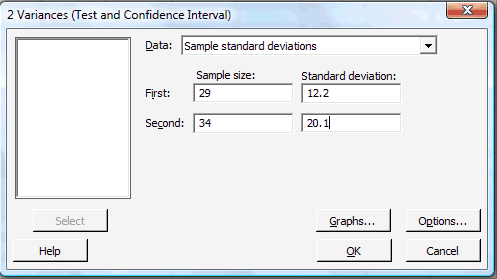
-
Click on the button labeled Options... In the pop-up window that appears, in the box labeled Value, type in the Hypothesized ratio of the standard deviations (or the Hypothesized ratio of the variances). For the box labeled Alternative, select either less than, greater than, or not equal depending on the direction of the alternative hypothesis:
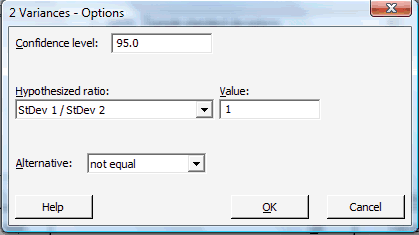
Then, click on OK to return to the main pop-up window.
-
Then, upon clicking OK on the main pop-up window, the output should appear in the Session window:
Test and CI for Two Variances
Method
Null hypothesis Sigma(1) / Sigma(2) = 1
Alternative hypothesis Sigma(1) / Sigma(2) not = 1
Significance level Alpha = 0.05
StatisticsSample N StDev Variance 1 29 12.200 148.840 2 34 20.100 404.010 Ratio of standard deviations = 0.607
Ratio of variances = 0.368
95% Confidence Intervals
TestsDistribution
of DataCI for StDev Ratio CI for
Variance RatioNormal (0.425, 0.877) (0.180, 0.770) Method DF1 DF2 Test
StatisticP-Value F Test (normal) 28 33 0.37 0.009
-