Recall that for a continuous random variable X, the median is the value m such that 50% of the time X lies below m and 50% of the time X lies above m, such as illustrated in this example here:
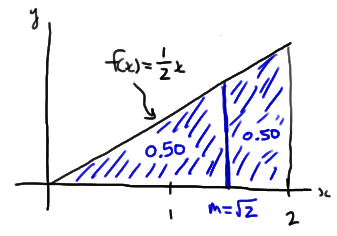
Throughout our discussion, and as the above illustration suggests, we'll assume that our random variable X is a continuous random variable with unknown median m. Upon taking a random sample \(X_1 , X_2 , \dots , X_n\), we'll be interested in testing whether the median m takes on a particular value \(m_0\). That is, we'll be interested in testing the null hypothesis:
\(H_0 \colon m = m_0 \)
against any of the possible alternative hypotheses:
\(H_A \colon m > m_0\) or \(H_A \colon m < m_0\) or \(H_A \colon m \ne m_0\)
Let's start by considering the quantity \(X_i - m_0\) for \(i = 1, 2, \dots , n\). If the null hypothesis is true, that is, \(m = m_0\), then we should expect about half of the \(x_i - m_0\) quantities obtained to be positive and half to be negative:
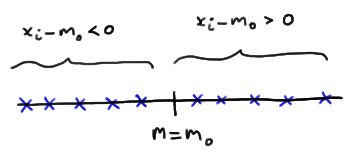
If instead, \(m > m_0\) , then we should expect more than half of the \(x_i - m_0\) quantities obtained to be positive and fewer than half to be negative:

Or, if instead, \(m < m_0\) , then we should expect fewer than half of the \(x_i - m_0\) quantities obtained to be positive and more than half to be negative:

This analysis of \(x_i - m_0\) under the three situations \(m = m_0\), \(m > m_0\) , and \(m < m_0\) suggests then that a reasonable test for testing the value of a median m should depend on \(X_i - m_0\) . That's exactly what the sign test for a median does. This is what we'll do:
- Calculate \(X_i - m_0\) for \(i = 1, 2, \dots , n\).
- Define N− = the number of negative signs obtained upon calculating \(X_i - m_0\) for \(i = 1, 2, \dots , n\).
- Define N+ = the number of positive signs obtained upon calculating \(X_i - m_0\) for \(i = 1, 2, \dots , n\).
Then, if the null hypothesis is true, that is, \(m = m_0\), then N− and N+ both follow a binomial distribution with parameters n and p = 1/2. That is:
\(N-\sim b\left(n, \frac{1}{2}\right)\) and \(N+\sim b\left(n, \frac{1}{2}\right)\)
Now, suppose we are interested in testing the null hypothesis \(H_0 \colon m = m_0\) against the alternative hypothesis \(H_A \colon m > m_0\). Then, if the alternative hypothesis were true, we should expect \(X_i - m_0\) to yield more positive (+) signs than would be expected if the null hypothesis were true:

In that case, we should reject the null hypothesis if n−, the observed number of negative signs, is too small, or alternatively, if the P-value as defined by:
\(P = P(N - \le n-)\)
is small, that is, less than or equal to \(\alpha\).
And, suppose we are interested in testing the null hypothesis \(H_0 \colon m = m_0\) against the alternative hypothesis \(H_A \colon m < m_0\). Then, if the alternative hypothesis were true, we should expect \(X_i - m_0\) to yield more negative (−) signs than would be expected if the null hypothesis were true:

In that case, we should reject the null hypothesis if n+, the observed number of positive signs, is too small, or alternatively, if the P-value as defined by:
\(P = P(N+ \le n+)\)
is small, that is, less than or equal to \(\alpha\).
Finally, if we are interested in testing the null hypothesis \(H_0 \colon m = m_0\) against the alternative hypothesis \(H_A \colon m \neq m_0\), it makes sense that we should reject the null hypothesis if we have too few negative signs or too few positive signs. Formally, we reject if \(n_{min}\), which is defined as the smaller of n− and n+, is too small. Alternatively, we reject if the P-value as defined by:
\(P = 2 \times P(N_{min} \le min(n-, n+))\)
is small, that is, less than or equal to \(\alpha\). Let's take a look at an example.
Example 20-1 Section

Recent studies of the private practices of physicians who saw no Medicaid patients suggested that the median length of each patient visit was 22 minutes. It is believed that the median visit length in practices with a large Medicaid load is shorter than 22 minutes. A random sample of 20 visits in practices with a large Medicaid load yielded, in order, the following visit lengths:
9.4 13.4 15.6 16.2 16.4 16.8 18.1 18.7 18.9 19.1
 19.3 20.1 20.4 21.6 21.9 23.4 23.5 24.8 24.9 26.8
Based on these data, is there sufficient evidence to conclude that the median visit length in practices with a large Medicaid load is shorter than 22 minutes?
Answer
We are interested in testing the null hypothesis \(H_0 \colon m = 22\) against the alternative hypothesis \(H_A \colon m < 22\). To do so, we first calculate \(x_i − 22\), for \(i = 1, 2, \dots, 20\). Letting Minitab do the 20 subtractions for us, we get:
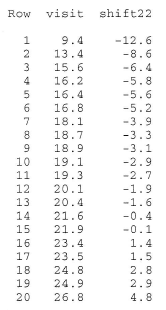
We can readily see that \(n+\), the observed number of positive signs, is 5. Therefore, we need to calculate how likely it would be to observe as few as 5 positive signs if the null hypothesis were true. Doing so, we get a P-value of 0.0207:

which is, of course, smaller than \(\alpha = 0.05\). The P-value tells us that it is not likely that we would observe so few positive signs if the null hypothesis were true. Therefore, we reject the null hypothesis in favor of the alternative hypothesis. There is sufficient evidence, at the 0.05 level, to conclude that the median visit length in practices with a large Medicaid load is shorter than 22 minutes.
Incidentally, we can use Minitab to conduct the sign test for us by selecting, under the Stat menu, Nonparametrics and then 1-Sample Sign. Doing so, we get:

Let's take a look at an example that illustrates how the sign test can even be applied to a situation in which the data are paired.
Example 20-2 Section

A study is done to determine the effects of removing a renal blockage in patients whose renal function is impaired because of advanced metatstatic malignancy of nonurologic cause. The arterial blood pressure of a random sample of 10 patients is measured before and after surgery for treatment of the blockage yielded the following data:
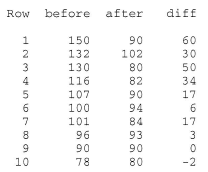
Based on the sign test, can we conclude that the surgery tends to lower arterial blood pressure?
Answer
We are interested in testing the null hypothesis \(H_0 \colon m_D = m_{B−A} = 0\) against the alternative hypothesis \(H_A \colon m_D = m_{B−A} > 0\). To do so, we just have to conduct a sign test while treating the differences as the data. If we look at the differences, we see that one of the differences is neither positive or negative, but rather zero. In this case, the standard procedure is to remove the observation that produces the zero, and reduce the number of observations by one. That is, we conduct the sign test using n = 9 rather than n = 10.
Now, n−, the observed number of negative signs, is 1, which yields a P-value of 0.0195:

The P-value is less than 0.05. Therefore, we can reject the null hypothesis. There is sufficient evidence, at the 0.05 level, to conclude that the surgery tends to lower arterial blood pressure.
Again, we can use Minitab to conduct the sign test for us. Doing so, we get:

Let's close up our discussion of the sign test by taking a note of the following:
- The sign test was presented here as a test for the median \(H_0 \colon m = m_0\), but if we were to make the additional assumption that the distribution of X is symmetric, then the sign test is also a valid test for the mean \(H_0 \colon \mu = \mu_0\).
- A primary advantage of the sign test is that by using only the signs of the \(X_i - m_0\) quantities, the test completely obliterates the negative effect of outliers.
- A primary disadvantage of the sign test is that by using only the signs of the \(X_i - m_0\) quantities, we potentially lose useful information about the magnitudes of the \(X_i - m_0\) quantities. For example, which data have more evidence against the null hypothesis \(H_0 \colon m = m_0\)? (1, 1, −1) versus (5, 6, −1)? Or (1, 1, −1) versus (10000, 6, −1)?
That last point suggests that we might want to also consider a test that takes into account the magntitudes of the \(X_i - m_0\) quantities. That's exactly what the Wilcoxon signed rank test does. Let's go check it out.