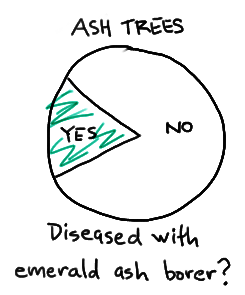
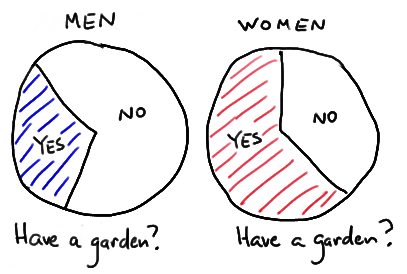
Let's start by considering only those methods that are appropriate for the case in which we have a binary response. You know... that means just two possible outcomes... such as, smoker or non-smoker? blue eyes or not? loves statistics or doesn't? Then, consider only those methods that are appropriate for the case in which we are studying just one group... such as, college seniors, women over the age of 60, or ash trees.
One Group with a Binary Response Section

Suppose we are interested in learning the extent to which the population of ash trees in the eastern United States is diseased with the emerald ash borer. Well, in that situation, we are studying just one group, namely, the population of ash trees in the eastern United States. Then, we take a random sample of n ash trees from that population and determine whether or not each tree is diseased with the emerald ash borer. In that situation, we have a binary response, namely, either the tree is or is not diseased. As soon as we determine that we are studying one group with a binary response, we should be thinking proportions, proportions, proportions. That is, a proportion is a natural way of summarizing the observed data, so therefore the statistical methods we should consider using must necessarily concern proportions. Specifically, our options are:
- performing a Z-test for one proportion
- performing a chi-square test
- calculating a Z-interval for one proportion
What we choose depends on our specific research question. If we are just interested in determining whether a majority \((p > 0.50)\) of the ash trees are diseased, a Z-test for one proportion will suffice. If we have some previous idea about the value of the proportion, \(p_0\), say of diseased trees in mind, and don't care whether the proportion is now smaller or larger than \(p_0\), then a chi-square test will suffice, as it allows for two-sided alternative hypotheses. Of course, we could just as well perform a two-sided Z-test for one proportion in that case. The P-values, and hence the final decisions, will be the same. If, on the other hand, we are only interested in estimating the unknown proportion p of diseased ash trees in the eastern United States, then we should calculate a 95% Z-interval for one proportion.
I always like to say that deciding whether to go the hypothesis test or confidence interval route depends on whether the research question involves a "is it this" or "what is it" question. That is, the research question "is the proportion of diseased trees different from 0.4?" involves conducting a hypothesis test, whereas the research question "what is the proportion of diseased trees?" involves calculating a confidence interval.
Once we've determined the appropriate statistical method, we can turn to a statistical analysis package, such as Minitab, to help with the analysis. In Minitab, we use the commands:
- Stat >> Basic Stat >> 1 Proportion... to conduct a Z-test for one proportion or to calculate a Z-interval for one proportion
- Stat >> Tables >> Cross Tabulation and Chi-Square... to conduct a chi-square test
The details about how to perform the analyses in Minitab, as well as about the assumptions that must be made, can be found in the relevant lessons.
Example 28-1 Section

Do a majority of college students work during the semester?
Answer
The research question involves the study of one group, namely college students. The research question involves a binary response... either a student does or does not work during the semester. The research question is an "is it this?" question, and therefore involves conducting a hypothesis test. If p is the (unknown) proportion of college students who work during the semester, then we are specifically interested in testing the null hypothesis \(H_0: p = 0.50\) against the alternative hypotheses \(H_A: p > 0.50\). We can enter the resulting data into Minitab and then ask Minitab to conduct a Z-test for one proportion for us.
Incidentally, this discussion of whether or not we should conduct a hypothesis test or calculate a confidence interval is a bit like splitting hairs. That's because, as you might recall, a confidence interval can always be used to answer an "is it this?" question, too. For example, in this case, we could calculate a confidence interval for p, and then if the confidence interval only contains values greater than 0.50, then we can reject the null hypothesis \(H_0: p = 0.50\) in favor of the alternative hypotheses \(H_A: p > 0.50\). In practice, most statisticians do both, that is, conduct and report the results of both the hypothesis test and the confidence interval.
Example 28-2 Section

What proportion of college students have an E in their last name?
Answer
The research question involves the study of one group, namely college students. The research question involves a binary response... either a student does or does not have an E in his or her last name. The research question is a "what is it?" question, and therefore involves calculating a confidence interval. If p is the (unknown) proportion of college students who have an E in their last name, then we are specifically interested in estimating p. We can enter the resulting data into Minitab and then ask Minitab to calculate a Z-interval for one proportion for us.
Two Groups with a Binary Response Section

Suppose we are interested in learning the extent to which the population of American men and the population of American women have a garden. In this case, we are clearly studying two groups, namely, the population of American men and the population of American women. Then, we take a random sample of \(n_1\) men and \(n_2\) women from each population and determine whether or not each person has a garden. In this case, we have a binary response, namely, either the person has a garden or does not. As soon as we determine that we are studying two groups with a binary response, we should be thinking two proportions, two proportions, two proportions. That is, a proportion is a natural way of summarizing the data observed from each population, so therefore the statistical methods we should consider using must necessarily concern two proportions. Specifically, our options are:
- performing a Z-test for two proportions
- performing a chi-square test
- calculating a Z-interval for two proportions
What we choose depends on our specific research question. Again, if the research question is an "is it this?" question, then we'd want to conduct a hypothesis test, whereas if it's a "what is it?" question, we'd want to calculate a confidence interval. For example, if we're only interested in determining whether or not the two population proportions \(p_1\) and \(p_2\) are equal, then either the Z-test for two proportions or the chi-square test would suffice. On the other hand, if we are interested in quantifying the extent to which the two proportions differ (or not), then we'd better calculate a confidence interval.
Again, once we've determined the appropriate statistical method, we can turn to a statistical analysis package, such as Minitab, to help with the analysis. In Minitab, we use the commands:
- Stat >> Basic Stat >> 2 Proportions... to conduct a Z-test for two proportions or to calculate a Z-interval for two proportions
- Stat >> Tables >> Cross Tabulation and Chi-Square... to conduct a chi-square test
The details about how to perform the analyses in Minitab, as well as about the assumptions that must be made, can be found in the relevant lessons.
Example 28-3 Section

Do elderly males and elderly females snore at a different rate?
Answer
The research question involves the study of two groups, namely elderly males and elderly females. The research question involves a binary response... either a person does or does not snore. The research question is an "is it this?" question, and therefore involves conducting a hypothesis test. In this case, the question involves determining whether or not the difference in the two proportions \(p_1\) and \(p_2\) is 0. That is, if p1 is the (unknown) proportion of elderly males who snore, and \(p_2\) is the (unknown) proportion of elderly females who snore, then we are specifically interested in testing the null hypothesis \(H_0: p_1−p_2 = 0\) against the alternative hypotheses \(H_A: p_1−p_2 ≠ 0\). We can enter the resulting data into Minitab and then ask Minitab to conduct either a chi-square test or a Z-test for two proportions for us.
All of the examples that we have considered thus far on this page have involved a binary response variable. Let's now consider the possibility that the response is a general categorical variable.
Two or More Groups with a Categorical Response Section

Suppose we are interested in determining whether preference for one of four presidential candidates is independent of a voter's affiliation with a major political party (Democrat, Republican, or Independent). In this case, we are studying three groups, namely, the population of Democrat voters, the population of Republican voters, and the population of Independent voters. Then, we take a random sample of \(n_1\) Democrats, \(n_2\) Republicans, and \(n_3\) Independents, and determine whether each person prefers candidate A, B, C, or D for president. In this case, we have a general categorical response, namely, either the person prefers candidate A, B, C or D. As soon as we determine that we are studying two or more groups with a categorical response, we should be thinking chi-square test. In Minitab, we use the commands Stat >> Tables >> Cross Tabulation and Chi-Square... to conduct the test.
Example 28-4 Section

Is the rate of smoking independent of semester standing? One-hundred randomly selected students from each of the four classes (freshmen, sophomores, juniors, and seniors) are asked about their smoking behavior (never, a few times, regularly, addicted).
Answer
The research question involves the study of four groups, namely freshmen, sophomores, juniors, and seniors. The research question involves a categorical response... either a person classifies him- or herself as having never smoked, as having smoked a few times, as a regular smoker, or as being completely addicted. The research question involves assessing the independence of the two variables, smoking and semester standing. In summarizing the data, we determine the proportion of freshmen falling into each category of smokers, the proportion of sophomores falling into each category of smokers, the proportion of juniors falling into each category of smokers, and the proportion of seniors falling into each category of smokers. We can enter the resulting data into Minitab and then ask Minitab to conduct a chi-square test for us.