Minitab®
Use Minitab to calculate the confidence and/or prediction intervals Section
For any sizeable data set, and even for the small ones, you'll definitely want to use Minitab to calculate the confidence and/or prediction intervals for you. To do so:
-
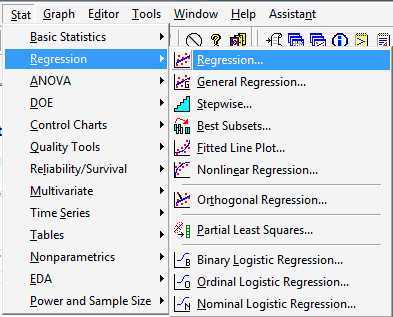
Under the Stat menu, select Stat, and then select Regression:
-
In the pop-up window that appears, in the box labeled Response, specify the response and, in the box labeled Predictors, specify the predictor variable:
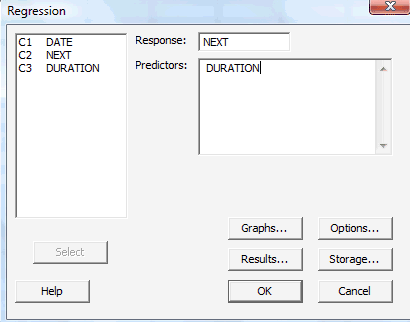
Then, click on the Options... button.
-
In the pop-up window that appears, in the box labeled Prediction intervals for new observations, type the value of the predictor variable for which you'd like a confidence interval and/or prediction interval:
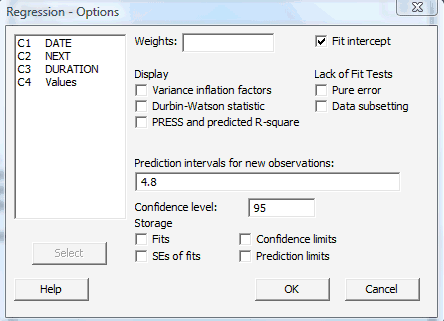
In the box labeled Confidence level, type your desired confidence level. (The default is 95.) Then, select OK.
-
And, select OK on the main pop-up window. The output should appear in the session window. The first part of the output should look something like this:
The regression equation is NEXT = 33.8 + 10.7 DURATION
Predictor Coef SE Coef T P Constant 33.828 2.262 14.96 0.000 DURATION 10.7410 0.6263 17.15 0.000 Analysis of Variance
Source DF SS MS F P Regression 1 13133 13133 294.08 0.000 Residual Error 105 4689 45 0.000 Total
106 17822 while the second part of the output, which contains the requested intervals, should look something like this:
Predicted Values for New Observations
New Obs Fit SE Fit 95% CI 95 % PI 1 85.385 1.059 (83.286, 87.484) (71.969, 98.801) Values of Predictors for New Observations
New Obs DURATION 1 4.80