- 95% Rule
- On a normal distribution approximately 95% of data will fall within two standard deviations of the mean; this is an abbreviated form of the Empirical Rule
- Alternative Hypothesis
- The statement that there is some difference in the population(s), denoted as \(H_a\) or \(H_1\)
- Association
- A relationship between variables
- Bar chart
- Graphical representation for categorical data in which vertical (or sometimes horizontal) bars are used to depict the number of experimental units in each category; bars are separated by space.
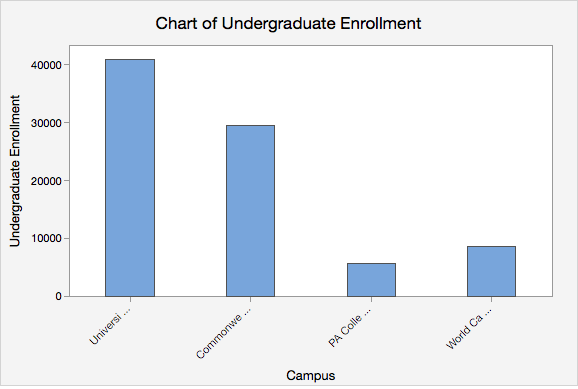
Penn State Fall 2017 Undergraduate Enrollments
- Bias
- The systematic favoring of certain outcomes.
- Binomial random variable
- A specific type of discrete random variable that counts how often a particular event occurs in a fixed number of tries or trials.
- Blinding
- Procedure employed in research to prevent bias in which the participants and/or the researchers interacting with the participations do not know which treatment each case is receiving.
- Bootstrapping
- A resampling procedure for constructing a sampling distribution using data from a sample.
- Case
- An experimental unit from which data are collected
- Categorical variable
- Names or labels (i.e., categories) with no logical order or with a logical order but inconsistent differences between groups, also known as qualitative.
- Causation
- Changes in one variable can be attributed to changes in a second variable.
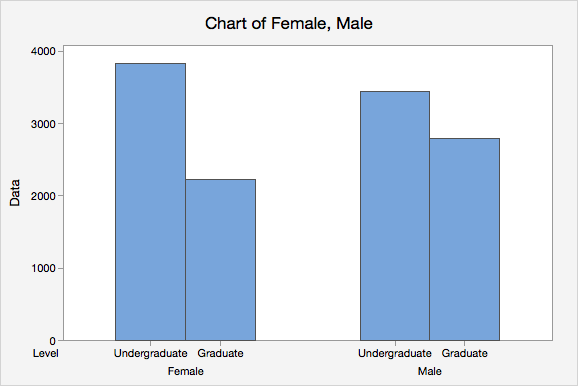
- Clustered Bar Chart
- Each bar represents one combination of the two categorical variables (i.e., one cell in a contingency table). This is also known as a side-by-side bar chart.
- Complement
-
The probability that the event does not occur. The complement of \(P(A)\) is \(P(A^C)\). This may also be written as \(P(A')\).
In the diagram below we can see that \(A^{C}\) is everything in the sample space that is not A.
Complement of A
- Conditional Probability
-
The probability of one event occurring given that it is known that a second event has occurred. This is communicated using the symbol \(\mid\) which is read as "given."
For example, P(A\mid B) is read as "Probability of A given B."
- Confidence Interval
- A range computed using sample statistics to estimate an unknown population parameter with a stated level of confidence.
- Confounding Variable
- Characteristic that varies between cases and is related to both the explanatory and response variables; also known as a lurking variable or a third variable.
- Continuous variable
- Characteristic that varies and can take on any value and any value between values.
- Control Group
- A level of the explanatory variable that does not receive an active treatment; they may receive no treatment or a placebo.
- Convenience Sampling
- A method of obtaining a sample from a population by ease of accessibility; such a sample is not random and may not be representative of the intended population.
- Correlation
- A measure of the direction and strength of the relationship between two variables.
- Deviation
- An individual score minus the mean.
- Discrete variable
- Characteristic that varies and can only take on a set number of values.
- Disjoint Events
-
Two events that do not occur at the same time. These are also known as mutually exclusive events.
In the Venn diagram below event A and event B are disjoint events because the two do not overlap.
Mutually Exclusive
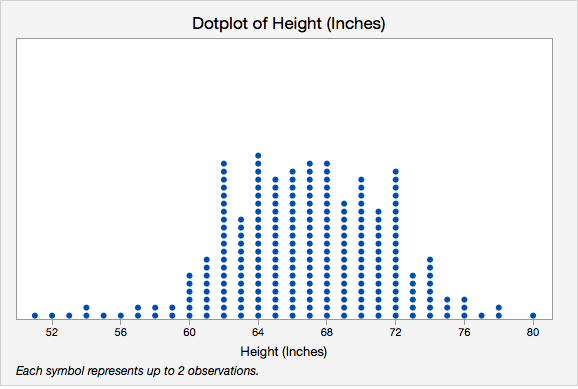
- Dotplot
- Double-Blind Study
- Research study in which neither the participants nor the researchers interacting with them know which cases have been assigned to which treatment groups.
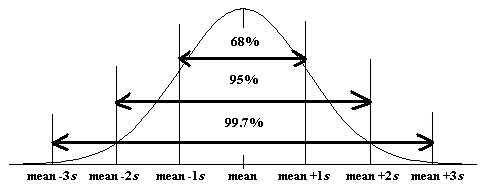
- Empirical Rule
- On a normal distribution about 68% of data will be within one standard deviation of the mean, about 95% will be within two standard deviations of the mean, and about 99.7% will be within three standard deviations of the mean.
- Experimental Research Design
- A study in which the researcher manipulates the treatments received by subjects and collects data; also known as a scientific study
- Explanatory Variable
- Variable that is used to explain variability in the response variable, also known as an independent or predictor variable, it explains variations in the response variable; in an experimental study, it is manipulated by the researcher.
- Frequency Table
- A table containing the counts of how often each category occurs.
-
Summary Statistics Campus Count Percent University Park 40835 48.5% Commonwealth Campuses 29388 34.9% PA College of Technology 5465 6.5% World Campus 8513 10.1% Total 84201 100.0% Penn State Fall 2017 Undergraduate Enrollments
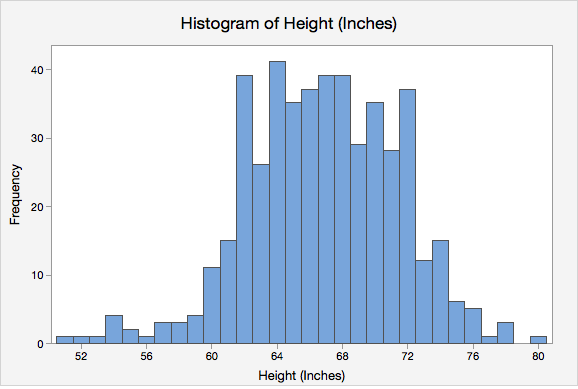
- Histogram
- Independent Events
- Unrelated events. The outcome of one event does not impact the outcome of the other event.
- Independent Groups
- Cases in each group are unrelated to one another.
- Inferential Statistics
- Statistical procedures that use data from an observed sample to make a conclusion about a population.
- Interquartile range (IQR)
- The difference between the first and third quartiles.
- Intersection
-
The overlap of two or more events and is symbolized by the character \(\cap\).
\(P(A \cap B)\) is read as "the probability of A and B."
Intersection of A and B
- Least squares method
- Method of constructing a regression line which makes the sum of squared residuals as small as possible for the given data.
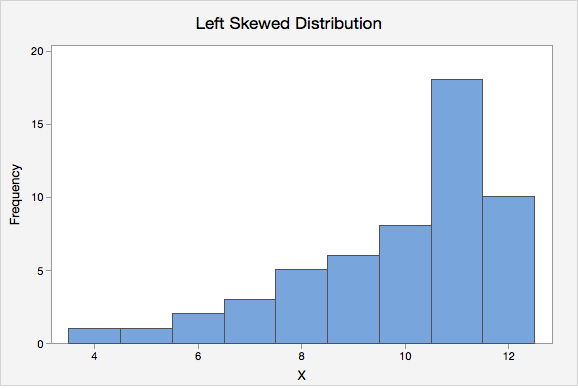
- Left Skewed
- A distribution in which the lower values (towards the left on a number line) are more spread out than the higher values. This is also known as negatively skewed.
- Margin of Error
- Half of the width of a confidence interval; equal to the multiplier times the standard error.
- Mean
-
The numerical average; calculated as the sum of all of the data values divided by the number of values.
The sample mean is represented as \(\overline{x}\) ("x-bar") and the population mean is denoted as the Greek letter \(\mu\) ("mu"). The formula is the same for the sample mean and the population mean.
- Median
- The middle of the distribution that has been ordered from smallest to largest; for distributions with an even number of values, this is the mean of the two middle values.
- Mode
- The most frequently occurring value(s) in the distribution, may be used with quantitative or categorical variables.
- Non-Response Bias
- Systematic favoring of certain outcomes that occurs when the individuals who choose participate in a study differ from the individuals who choose to not participate.
- Normal Distribution
- One specific type of symmetrical distribution. This is also known as a bell-shaped distribution.
- Null Hypothesis
- The statement that there is not a difference in the population(s), denoted as \(H_0\)
- Observational Research Design
- A study in which the researcher collects data without performing any manipulations; also known as a non-experimental study
- Odds
- Express risk by comparing the likelihood of an event happening to the likelihood it does not happen. Note that the interpretation of odds is different from the interpretation of risk/probability/proportion.
- p-value
- Given that the null hypothesis is true, the probability of obtaining a sample statistic as extreme or more extreme than the one in the observed sample, in the direction of the alternative hypothesis.
- Paired Groups
- Cases in each group are meaningfully matched with one another; also known as dependent samples or matched pairs.
- Parameter
- A measure concerning a population (e.g., population mean).
- Percentile
- Proportion of a distribution less than a given value.
- Pie chart
-
Graphical representation for categorical data in which a circle is partitioned into “slices” on the basis of the proportions of each category.
Pie Chart of Campus Penn State Fall 2017 Undergraduate Enrollments
- Placebo Group
- A group that receives what, to them, appears to be a treatment, but actually is neutral and does not contain any active treatment (e.g., a sugar pill in a medication study).
- Point Estimate
- Sample statistic that serves as the best estimate for a population parameter.
- Population
- The entire set of possible cases.
- Quantitative variable
- Numerical values with magnitudes that can be placed in a meaningful order with consistent intervals, also known as numerical.
- Randomization
- The act of randomly assigning cases to different levels of the explanatory variable.
- Range
- The difference between the maximum and minimum values.
- Relative Risk
- Relative risk compares the risk of a particular outcome in two different groups.
- Representative Sample
- A subset of the population from which data are collected that accurately reflects the population.
- Residual
- The difference between an observed y value and the predicted y value. In other words, \(y-\widehat y\). On a scatterplot, this is the vertical distance between the line of best fit and the observation. In a sample this may be denoted as \(e\) or \(\widehat \epsilon\) ("epsilon-hat") and in a population this may be denoted as \(\epsilon\) ("epsilon").
- Response Bias
- Systematic favoring of certain outcomes that occurs when participants do not respond truthfully; they may do so to align with social norms or to appease the researcher.
- Response Variable
- Also known as the dependent or outcome variable, its value is predicted or its variation is explained by the explanatory variable; in an experimental study, this is the outcome that is measured following manipulation of the explanatory variable.
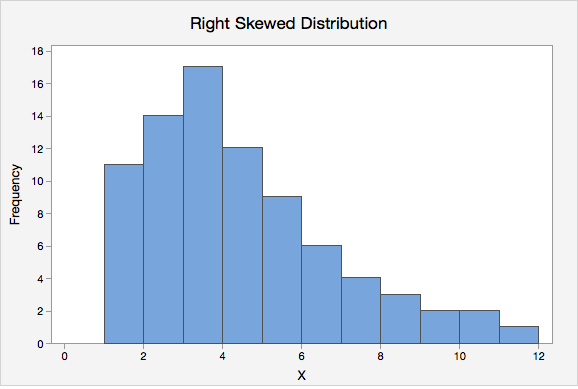
- Right Skew
- A distribution in which the higher values (towards the right on a number line) are more spread out than the lower values. This is also known as positively skewed.
- Risk
- The probability that an event will occur. It may be written as a decimal, a fraction, or a percent.
- Sample
- A subset of the population from which data are collected,
- Sampling Bias
- Systematic favoring of certain outcomes due to the methods employed to obtain the sample.
- Sampling Distribution
- Distribution of sample statistics with a mean approximately equal to the mean in the original distribution and a standard deviation known as the standard error.
- Scatterplot
- A graphical representation of two quantitative variables in which the explanatory variable is on the x-axis and the response variable is on the y-axis.
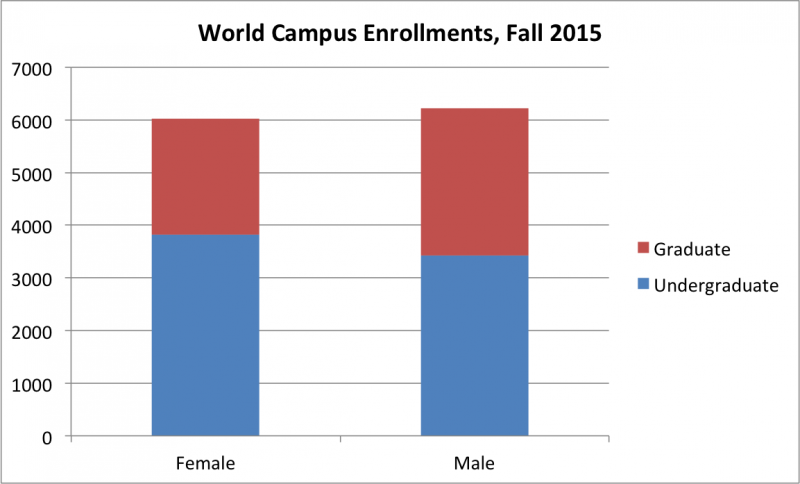
- Segmented Bar Chart
- Also known as a stacked bar chart, one categorical variable is represented on the x-axis while the second categorical variable is denoted within the bars.
- Simple Random Sampling
- A method of obtaining a sample from a population in which every member of the population has an equal chance of being selected.
- Single Boxplot
- Graph displaying data from one quantitative variable. Also known as a "box-and-whisker plot." The box represents the middle 50% of observed values. The bottom of the box is the first quartile (25th percentile) and the top of the box is the third quartile (75th percentile). The line in the middle of the box is the median (50th percentile). The lines, also known as whiskers, extend to the lowest and highest values that are not outliers. Outliers are symbolized using asterisks or circles.
- Single-Blind Study
- Research study in which the participants do not know the treatment group that they have been assigned to.
- Skewed
- A distribution in which values are more spread out on one side of the center than on the other.
- Standard Deviation
- Roughly the average difference between individual data values and the mean. The standard deviation of a sample is denoted as \(s\). The standard deviation of a population is denoted as \(\sigma\).
- Standard Error
- Standard deviation of a sampling distribution.
- Statistic
- A measure concerning a sample (e.g., sample mean).
- Statistical literacy
-
“People’s ability to interpret and critically evaluate statistical information and data-based arguments appearing in diverse media channels, and their ability to discuss their opinions regarding such statistical information” (Gal, as cited by Rumsey, 2002)
Rumsey, D. J. (2002). Statistical literacy as a goal for introductory statistics courses. Journal of Statistics Education, 10(3). Retrieved from: http://www.amstat.org/publications/jse/v10n3/rumsey2.html
- Statistical significance
- Sample statistics vary from the specified population parameters to the extent that it is unlikely that the results obtained were due to random sampling error, rather we conclude that the differences observed in the sample were due to actual differences in the population.
- Statistics
- The art and science of answering questions and exploring ideas through the processes of gathering data, describing data, and making generalizations about a population on the basis of a smaller sample.
- Sum of Squared Deviations
- Deviations squared and added together. This is also known as the sum of squares or SS.
- Sum of squared Residuals
- The sum of all of the residuals squared: \(\sum (y-\widehat{y})^2\).
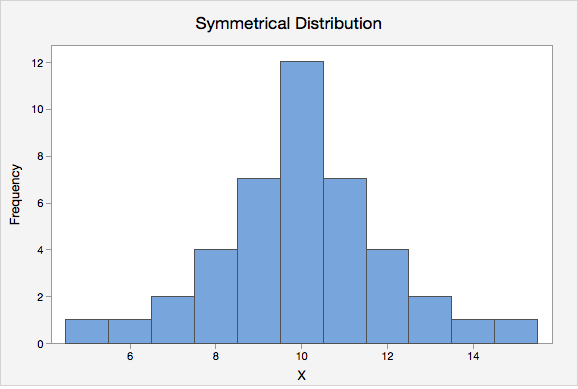
- Symmetrical Distribution
- A distribution that is similar on both sides of the center.
- Two-Way Table
- A display of counts for two categorical variables in which the rows represent one variable and the columns represent a second variable. Also known as a contingency table.
- Type I Error
- Rejecting \(H_0\) when \(H_0\) is really true, denoted by \(\alpha\) ("alpha") and commonly set at .05.
- \(\alpha=P(Type\;I\;error)\)
- Type II Error
- Failing to reject \(H_0\) when \(H_0\) is really false, denoted by \(\beta\) ("beta").
- \(\beta=P(Type\;II\;error)\)
- Union
-
A union contains the area in A or B and is symbolized by \(\cup\). Note that this also includes the overlap of A and B (i.e., the intersection).
\(P(A \cup B)\) is read as "the probability of A or B."
Union of A and B
- Variable
- Characteristic of cases that can take on different values (in other words, something that can vary).
- Variance
- Approximately the average of all of the squared deviations; for a sample represented as \(s^{2}\).
- Venn diagram
- A visual representation in which the sample space is depicted as a box and events are represented as circles within the sample space.
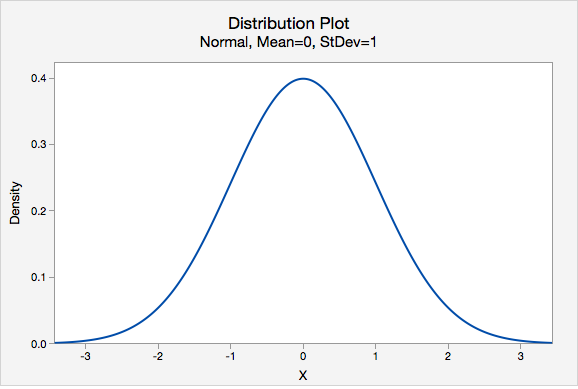
- z-distribution
- A bell-shaped distribution with a mean of 0 and standard deviation of 1, also known as the standard normal distribution.

- z-score
- Distance between an individual score and the mean in standard deviation units; also known as a standardized score.