Data concerning sales at student-run cafe were retrieved from cafedata.xls more information about this data set available at cafedata.txt. Let's determine if there is a statistically significant relationship between the maximum daily temperature and coffee sales.
For this example, you can use the following Minitab file: cafedata.mpx
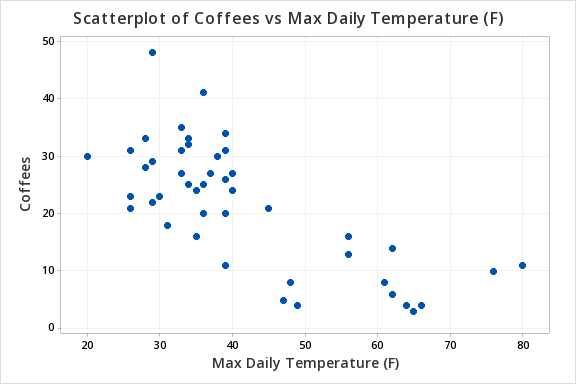
Maximum daily temperature and coffee sales are both quantitative variables. From the scatterplot below we can see that the relationship is linear.
\(H_0: \rho = 0\)
\(H_a: \rho \neq 0\)
From Minitab:
Pairwise Pearson Correlations
Sample 1 | Sample 2 | N | Correlation | 95% CI for \(\rho\) | P-Value |
|---|---|---|---|---|---|
Max Daily Temperature (F) | Coffees | 47 | -0.741 | (-0.848, -0.577) | 0.000 |
\(r=-0.741\)
\(p=.000\)
\(p \leq \alpha\) therefore we reject the null hypothesis.
There is convincing evidence of a relationship between the maximum daily temperature and coffee sales in the population.