Data concerning body measurements from 507 adults retrieved from body.dat.txt for more information see body.txt. In this example, we will use the variables of age (in years) and height (in centimeters) only.
For the full data set and descriptions see the original files:
For this example, you can use the following Minitab file: body.dat.mpx
Research question: Is there a relationship between age and height in adults?
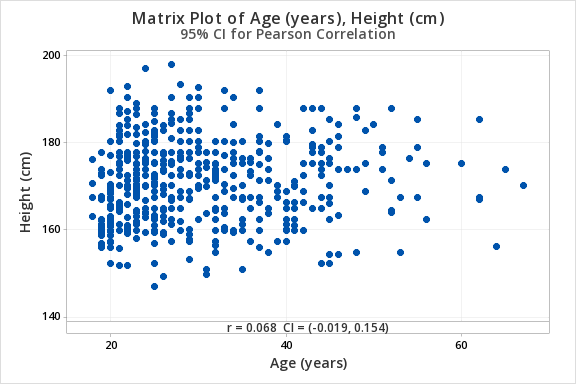
Age (in years) and height (in centimeters) are both quantitative variables. From the scatterplot below we can see that the relationship is linear (or at least not non-linear).
\(H_0: \rho = 0\)
\(H_a: \rho \neq 0\)
From Minitab:
Pairwise Pearson Correlations
| Sample 1 | Sample 2 | N | Correlation | 95% CI for \(\rho\) | P-Value |
|---|---|---|---|---|---|
| Height (cm) | Age (years) | 507 | 0.068 | (-0.019, 0.154) | 0.127 |
\(r=0.068\)
\(p=.127\)
\(p > \alpha\) therefore we fail to reject the null hypothesis.
There is not enough evidence of a relationship between age and height in the population from which this sample was drawn.