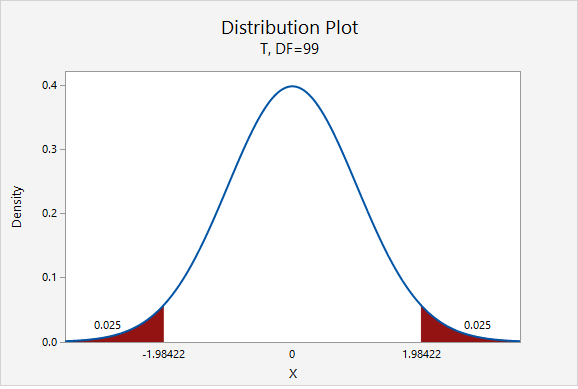
An educational research study is designed so that participants complete a measure of demonstrated knowledge twice. The researcher wants to estimate the change in scores from the first to second administrations (i.e., pre- and post-test). Data are paired by participant. The researcher subtracted pre-test scores from the post test scores and found a mean increase of 6.560 with a standard deviation of 3.867 for \(n=100\). She wants to construct a 95% confidence interval for the mean difference.
First, we'll find the appropriate multiplier.
\(df=n-1=100-1=99\)

For a 95% confidence interval: \(t_{df=99}=1.984\)
\(6.560 \pm 1.984 \left(\frac{3.867}{\sqrt{100}}\right)=6.560 \pm 0.767=[5.793, 7.327]\)
We are 95% confident that the mean difference between post- and pre- test scores in the population is between 5.793 and 7.327.
Data from Zimmerman, W. A. (2015). Impact of Instructional Materials Eliciting Low and High Cognitive Load on Self-Efficacy and Demonstrated Knowledge (Unpublished doctoral dissertation). The Pennsylvania State University, University Park, PA.