Recall from Lesson 3, regression uses one or more explanatory variables (\(x\)) to predict one response variable (\(y\)). In this lesson we will be learning specifically about simple linear regression. The "simple" part is that we will be using only one explanatory variable. If there are two or more explanatory variables, then multiple linear regression is necessary. The "linear" part is that we will be using a straight line to predict the response variable using the explanatory variable.
You may recall from an algebra class that the formula for a straight line is \(y=mx+b\), where \(m\) is the slope and \(b\) is the \(y\)-intercept. The slope is a measure of how steep the line is; in algebra this is sometimes described as "change in \(y\) over change in \(x\)," or "rise over run". A positive slope indicates a line moving from the bottom left to top right. A negative slope indicates a line moving from the top left to bottom right. For every one unit increase in \(x\) the predicted value of \(y\) increases by the value of the slope. The \(y\) intercept is the location on the \(y\) axis where the line passes through; this is the value of \(y\) when \(x\) equals 0.
In statistics, we use a similar formula:
- Simple Linear Regression Line in a Sample
- \(\widehat{y}=b_0 +b_1 x\)
-
\(\widehat{y}\) = predicted value of \(y\) for a given value of \(x\)
\(b_0\) = \(y\)-intercept
\(b_1\) = slope
In the population, the \(y\)-intercept is denoted as \(\beta_0\) and the slope is denoted as \(\beta_1\).
Some textbook and statisticians use slightly different notation. For example, you may see either of the following notations used:
\(\widehat{y}=\widehat{\beta}_0+\widehat{\beta}_1 x \;\;\; \text{or} \;\;\; \widehat{y}=a+b x\)
Note that in all of the equations above, the \(y\)-intercept is the value that stands alone and the slope is the value attached to \(x\).
Example: Interpreting the Equation for a Line Section
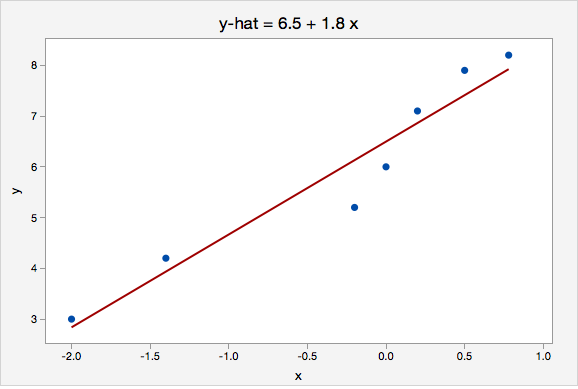
The plot below shows the line \(\widehat{y}=6.5+1.8x\)
Here, the \(y\)-intercept is 6.5. This means that when \(x=0\) then the predicted value of \(y\) is 6.5.
The slope is 1.8. For every one unit increase in \(x\), the predicted value of \(y\) increases by 1.8.
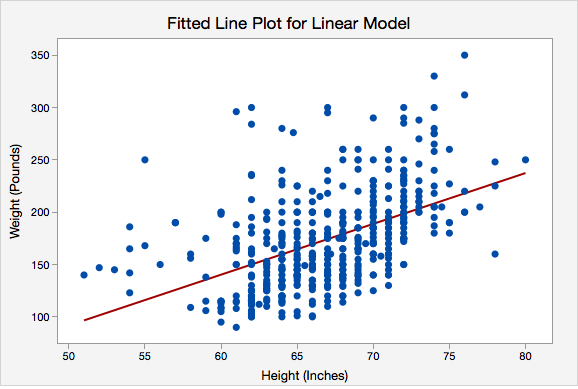
Example: Interpreting the Regression Line Predicting Weight with Height Section
Data were collected from a random sample of World Campus STAT 200 students. The plot below shows the regression line \(\widehat{weight}=-150.950+4.854(height)\)
Here, the \(y\)-intercept is -150.950. This means that an individual who is 0 inches tall would be predicted to weigh -150.905 pounds. In this particular scenario this intercept does not have any real applicable meaning because our range of heights is about 50 to 80 inches. We would never use this model to predict the weight of someone who is 0 inches tall. What we are really interested in here is the slope.
The slope is 4.854. For every one inch increase in height, the predicted weight increases by 4.854 pounds.
Review: Key Terms Section
In the next sections you will learn how to construct and test for the statistical significance of a simple linear regression model. But first, let's review some key terms:
- Explanatory variable
-
Variable that is used to explain variability in the response variable, also known as an independent variable or predictor variable; in an experimental study, this is the variable that is manipulated by the researcher.
- Response variable
-
The outcome variable, also known as a dependent variable.
- Simple linear regression
-
A method for predicting one response variable using one explanatory variable and a constant (i.e., the yy-intercept).
- y-intercept
-
The point on the \(y\)-axis where a line crosses (i.e., value of \(y\) when \(x = 0\)); in regression, also known as the constant.
- Slope
-
A measure of the direction (positive or negative) and steepness of a line; for every one unit increase in \(x\), the change in \(y\). For every one unit increase in \(x\) the predicted value of \(y\) increases by the value of the slope.