Minitab® – Obtaining Simple Linear Regression Output
We previously created a scatterplot of quiz averages and final exam scores and observed a linear relationship. Here, we will use quiz scores to predict final exam scores.
- Open the Minitab file: Exam.mpx
- Select Stat > Regression > Regression > Fit Regression Model...
- Select Final in the box on the left to insert it into the Response box on the right
- Select Quiz_Average in the box on the left to insert it into the Continuous Predictors box on the right
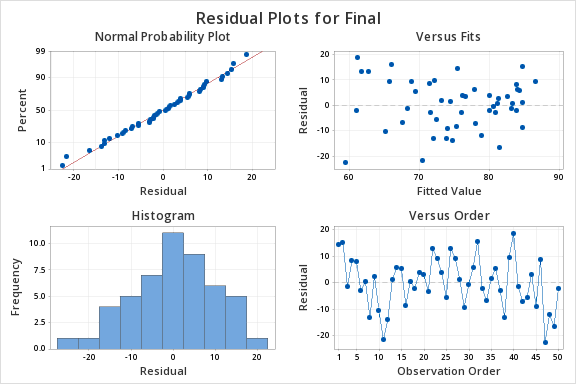
- Under the Graphs tab, click the box for Four in one
- Click OK
This should result in the following output:
Simple Regression: Final versus Quiz_Average
Regression Equation
Final = 12.1 + 0.751 Quiz_Average
Coefficients
| Term | Coef | SE Coef | T-Value | P-Value | VIF |
|---|---|---|---|---|---|
| Constant | 12.1 | 11.9 | 1.01 | 0.315 | |
| Quiz_Average | 0.751 | 0.141 | 5.31 | 0.000 | 1.00 |
Model Summary
| S | R-sq | R-sq(adj) | R-sq(pred) |
|---|---|---|---|
| 9.71152 | 37.04% | 35.73% | 29.82% |
Analysis of Variance
| Source | DF | Adj SS | Adj MS | F-Value | P-Value |
|---|---|---|---|---|---|
| Regression | 1 | 2664 | 2663.66 | 28.24 | 0.000 |
| Quiz_Average | 1 | 2664 | 2663.66 | 28.24 | 0.000 |
| Error | 48 | 4527 | 94.31 | ||
| Total | 49 | 7191 |
Fits and Diagnostics for Unusual Observations
| Obs | Final | Fit | Resid | Std Resid | |
|---|---|---|---|---|---|
| 11 | 49.00 | 70.50 | -21.50 | -2.25 | R |
| 40 | 80.00 | 61.22 | 18.78 | 2.03 | R |
| 47 | 37.00 | 59.51 | -22.51 | -2.46 | R |
R Large residual
On the next page you will learn how to test for the statistical significance of the slope.