Construct a correlation matrix to examine the relationship between how many hours per week students exercise, their heights, their weights, and their resting pulse rates.
This example uses the 'StudentSurvey' dataset from the Lock5 textbook. The data was collected from a sample of 362 college students.
To construct a correlation matrix in Minitab...
- Open the Minitab file: StudentSurvey.mpx
- Select Stat > Basic Statistics > Correlation
- Enter the variables Exercise, Height, Weight and Pulse into the Variables box
- Select the Graphs... button and select Correlations and p-values from the dropdown
- Select the Results... button and verify that the Correlation matrix and the Pairwise correlation table boxes are checked
- Click OK and OK
This should result in the following output:
Correlation
| Exercise | Height | Weight | |
|---|---|---|---|
| Height | 0.118 | ||
| Weight | 0.118 | 0.619 | |
| Pulse | -0.172 | -0.082 | -0.120 |
Pairwise Pearson Correlations
| Sample 1 | Sample 2 | N | Correlation | 95% CI for ρ | P-Value |
|---|---|---|---|---|---|
| Height | Exercise | 354 | 0.118 | (0.014, 0.220) | 0.026 |
| Weight | Exercise | 356 | 0.118 | (0.015, 0.220) | 0.026 |
| Pulse | Exercise | 361 | -0.172 | (-0.271, -0.071) | 0.001 |
| Weight | Height | 352 | 0.619 | (0.551, 0.680) | 0.000 |
| Pulse | Height | 355 | -0.082 | (-0.184, 0.023) | 0.124 |
| Pulse | Weight | 357 | -0.120 | (-0.221, -0.016) | 0.023 |
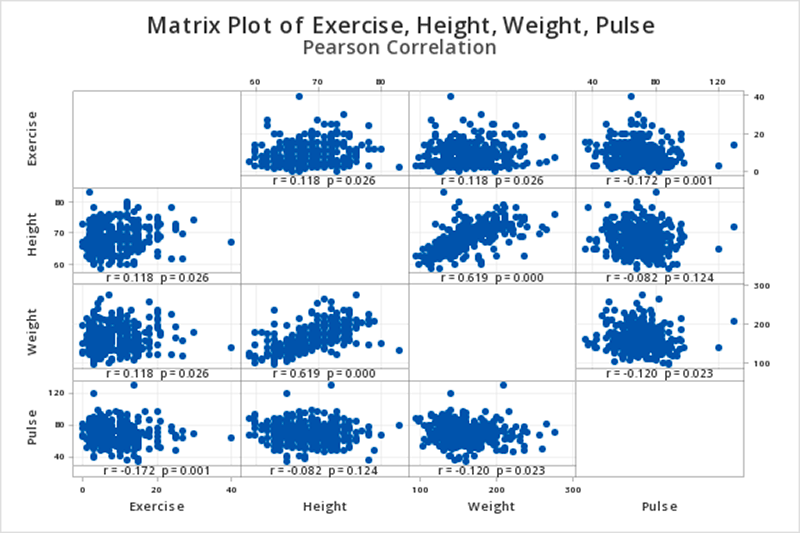
Interpretation
When we look at the matrix graph or the pairwise Pearson correlations table we see that we have six possible pairwise combinations (every possible pairing of the four variables). Let's say we wanted to examine the relationship between exercise and height. We would find the row in the pairwise Pearson correlations table where these two variables are listed for sample 1 and sample 2. In this case, that is the first row. The correlation between exercise and height is 0.118 and the p-value is 0.026.
If we were conducting a hypothesis test for this relationship, these would be step 2 and 3 in the 5 step process.