A chi-square goodness-of-fit test can be conducted when there is one categorical variable with more than two levels. If there are exactly two categories, then a one proportion z test may be conducted. The levels of that categorical variable must be mutually exclusive. In other words, each case must fit into one and only one category.
We can test that the proportions are all equal to one another or we can test any specific set of proportions.
If the expected counts, which we'll learn how to compute shortly, are all at least five, then the chi-square distribution may be used to approximate the sampling distribution. If any expected count is less than five, then a randomization test should be conducted.
- According to one research study, about 90% of American adults are right-handed, 9% are left-handed, and 1% are ambidextrous. Are the proportions of Penn State students who are right-handed, left-handed, and ambidextrous different from these national values?
- A concessions stand sells blue, red, purple, and green freezer pops. They survey a sample of children and ask which of the four colors is their favorite. They want to know if the colors differ in popularity.
Test Statistic
In conducting a goodness-of-fit test, we compare observed counts to expected counts. Observed counts are the number of cases in the sample in each group. Expected counts are computed given that the null hypothesis is true; this is the number of cases we would expect to see in each cell if the null hypothesis were true.
- Expected Cell Value
- \(E=n (p_i)\)
-
\(n\) is the total sample size
\(p_i\) is the hypothesized proportion of the "ith" group
The observed and expected values are then used to compute the chi-square (\(\chi^2\)) test statistic.
- Chi-Square (\(\chi^2\)) Test Statistic
-
\(\chi^2=\sum \dfrac{(Observed-Expected)^2}{Expected}\)
Approximating the Sampling Distribution
StatKey has the ability to conduct a randomization test for a goodness-of-fit test. There is an example of this in Section 7.1 of the Lock5 textbook. If all expected values are at least five, then the sampling distribution can be approximated using a chi-square distribution.
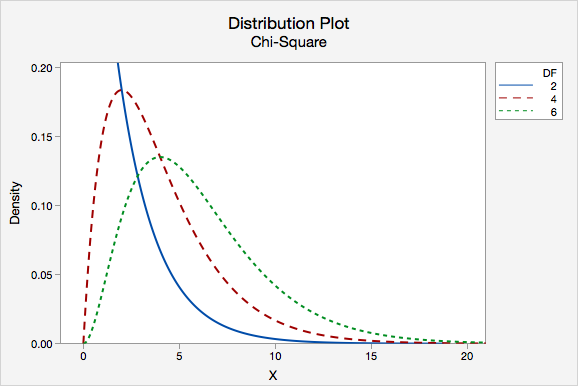
Like the t distribution, the chi-square distribution varies depending on the degrees of freedom. Degrees of freedom for a chi-square goodness-of-fit test are equal to the number of groups minus 1. The distribution plot below compares the chi-square distributions with 2, 4, and 6 degrees of freedom.
To find the p-value we find the area under the chi-square distribution to the right of our test statistic. A chi-square test is always right-tailed.