A research study measured the pulse rates of 57 college men and found a mean pulse rate of 70.4211 beats per minute with a standard deviation of 9.9480 beats per minute. Researchers want to know if the mean pulse rate for all college men is different from the current standard of 72 beats per minute.
Pulse rates are quantitative. The sampling distribution will be approximately normally distributed because \(n \ge 30\).
This is a two-tailed test because we want to know if the mean pulse rate is different from 72.
\(H_{0}:\mu=72 \)
\(H_{a}: \mu\neq 72 \)
- Test Statistic: One Group Mean
-
\(t=\dfrac{\overline{x}-\mu_0}{\dfrac{s}{\sqrt{n}}}\)
\(\overline{x}\) = sample mean
\(\mu_{0}\) = hypothesized population mean
\(s\) = sample standard deviation
\(n\) = sample size
\(t=\dfrac{\overline{x}-\mu_0}{\dfrac{s}{\sqrt{n}}}=\dfrac{70.4211-72}{\dfrac{9.9480}{\sqrt{57}}}=-1.198\)
Our \(t\) test statistic is -1.198
\(df=n-1=57-1=56\)
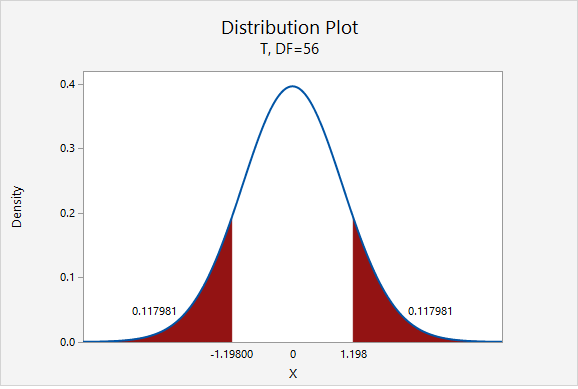
\(p=0.117981+0.117981=0.235962\)
Given that the null hypothesis is true and \(\mu=72\), the probability of taking a random sample of \(n=57\) and finding a sample mean this or more extremely different is 0.235962. This is our p-value.
\(p>.05\), therefore we fail to reject the null hypothesis.
There is not sufficient evidence to state that the mean pulse of college men is different from 72.