According to CNN, in 2011, the average American spent \$16,803 on housing. A suburban community wants to know if their residents spent less than this national average. In a survey of 30 randomly selected residents, they found that they spent an annual average of \$15,800 with a standard deviation of \$2,600.
Housing costs are quantitative. Because \(n \ge 30\), the sampling distribution can be approximated using the \(t\) distribution.
This is a left-tailed test because we want to know if residents of this community spent less than the national average.
\(H_{0}:\mu=16803\)
\(H_{a}:\mu<16803\)
Test Statistic: One Group Mean
\(t=\dfrac{\overline{x}-\mu_0}{\dfrac{s}{\sqrt{n}}}\)
\(\overline{x}\) = sample mean
\(\mu_{0}\) = hypothesized population mean
\(s\) = sample standard deviation
\(n\) = sample size
\(t=\dfrac{\overline{x}-\mu_0}{\dfrac{s}{\sqrt{n}}}=\dfrac{15800-16803}{\dfrac{2600}{\sqrt{30}}}=-2.113\)
Our t test statistics is -2.113
\(df=n-1=30-1=29\)
This is a left-tailed test so we want to know the probability of \(t < -2.113\)
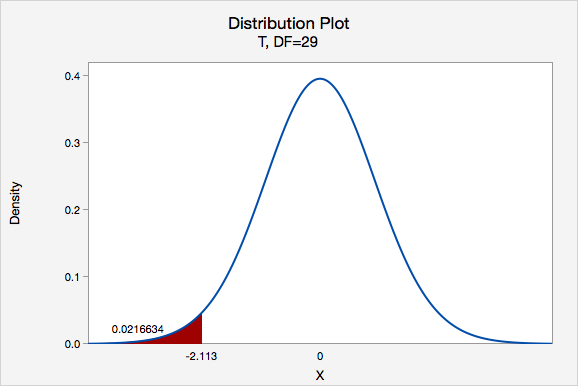
Using Minitab we can find that \(p=0.0216634\)
\(p\leq .05\), therefore we reject the null hypothesis.
There is convincing evidence to state that on average residents of this community spent less than the national average on housing in 2011.