One-way ANOVAs, along with a number of other statistical tests, use the F distribution. Earlier in this course you learned about the \(z\) and \(t\) distributions. You computed \(z\) and \(t\) test statistics and used those values to look up p-values using statistical software. Similarly, in this lesson you are going to compute F test statistics. The F test statistic can be used to determine the p-value for a one-way ANOVA.
The video below gives a brief introduction to the F distribution and walks you through two examples of using Minitab to find the p-values for given F test statistics. The steps for creating a distribution plot to find the area under the F distribution are the same as the steps for finding the area under the \(z\) or \(t\) distribution. For the F distribution we will always be looking for a right-tailed probability. Later in this lesson we will see that this area is the p-value.
The F distribution has two different degrees of freedom: between groups and within groups. Minitab will call these the numerator and denominator degrees of freedom, respectively. Within groups is also referred to as error.
- Between Groups (Numerator) Degrees of Freedom
-
\(df_{between}=k-1\)
-
\(k\) = number of groups
- Within Groups (Denominator, Error) Degrees of Freedom
-
\(df_{within}=n-k\)
-
\(n\) = total sample size with all groups combined
\(k\) = number of groups
Minitab® – Creating an F Distribution
Scenario: An F test statistic of 2.57 is computed with 3 and 246 degrees of freedom. What is the p-value for this test?
We can create a distribution plot. Our distribution is the F distribution. The numerator df (\(df_1\)) is 3 and the denominator df (\(df_2\)) is 246. We want to shade the area in the right tail. Our “X Value” is 2.57.
- Open Minitab
- Select Graph > Probability Distribution Plot > View Probability
- Change the Distribution to F
- Fill in the Numerator degrees of freedom with 3 and the Denominator degrees of freedom with 246
- Select the Options button
- Select A specified x value
- Use the default Right tail
- For the X value enter 2.57
- OK and OK
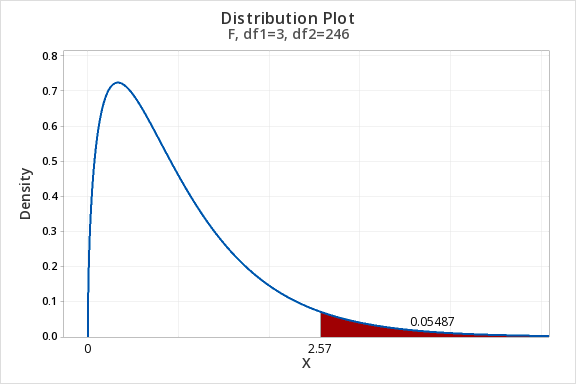
The area beyond an F-value of 2.57 with 3 and 246 degrees of freedom is 0.05487. The p-value for this F test is 0.05487.
Note: When you conduct an ANOVA in Minitab, the software will compute this p-value for you.