Minitab® – Simple Scatterplot
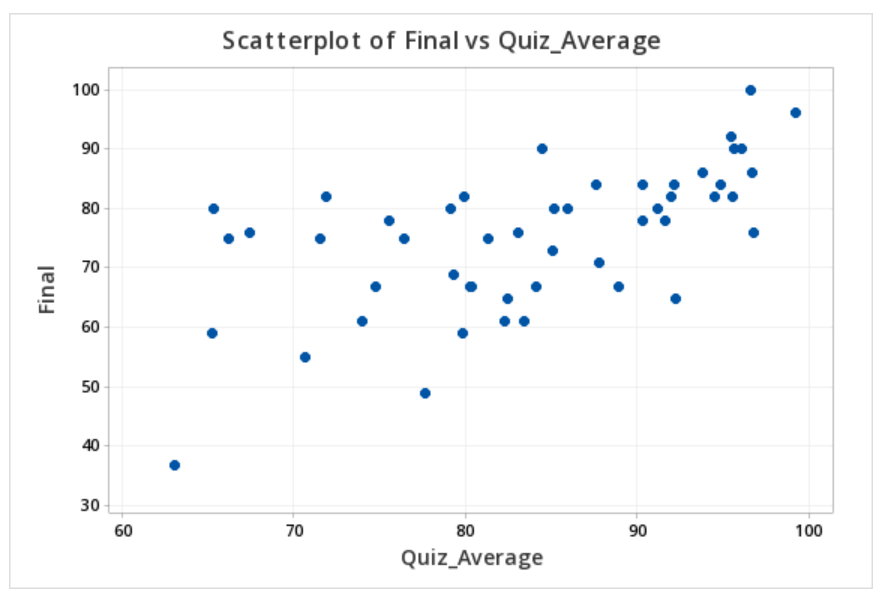
The file below contains data concerning students' quiz averages and final exam scores. Let's construct a scatterplot with the quiz averages on the horizontal axis and final exam scores on the vertical axis.
- Open the data file in Minitab
- From the tool bar, select Graphs > Scatterplot > One Y Variable > Simple
- Double click the variable Final on the left to move it to the Y variable box on the right
- Double click the variable Quiz_Average on the left to move it to the X variable box on the right
- Click OK
This should result in the scatterplot below:

Video Walkthrough