Research Question: Is the percentage of Creamery customers who prefer chocolate ice cream over vanilla less than 80%?
In a sample of 50 customers 60% preferred chocolate over vanilla.
\(np_0 = 50(0.80) = 40\)
\(n(1-p_0)=50(1-0.80) = 10\)
Both \(np_0\) and \(n(1-p_0)\) are at least 10. We can use the normal approximation method.
This is a left-tailed test because we want to know if the proportion is less than 0.80.
\(H_{0}\colon p=0.80\)
\(H_{a}\colon p<0.80\)
Test statistic: One Group Proportion
\(z=\dfrac{\widehat{p}- p_0 }{\sqrt{\frac{p_0 (1- p_0)}{n}}}\)
\(\widehat{p}\) = sample proportion
\(p_{0}\) = hypothesize population proportion
\(n\) = sample size
\(\widehat{p}=0.60\), \(p_{0}=0.80\), \(n=50\)
\(z= \dfrac{\widehat{p}- p_0 }{\sqrt{\frac{p_0 (1- p_0)}{n}}}= \dfrac{0.60-0.80}{\sqrt{\frac{0.80 (1-0.80)}{50}}}=-3.536\)
Our \(z\) test statistic is -3.536.
This is a left-tailed test so we need to find the area to the right of our test statistic, \(z=-3.536\).
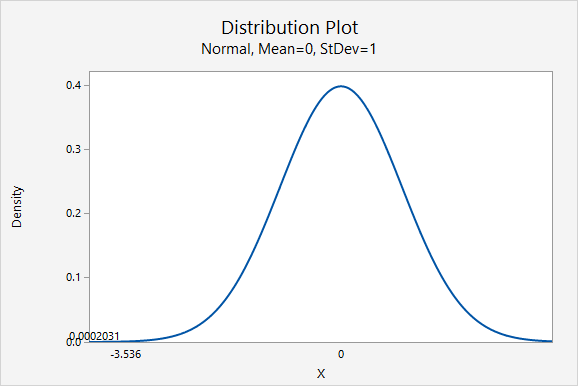
From the Minitab output above, the p-value is 0.0002031
\(p \leq.05\), therefore our decision is to reject the null hypothesis.
Yes, there is convincing evidence that the percentage of all Creamery customers who prefer chocolate ice cream over vanilla is less than 80%.