Earlier in this lesson we learned that the sampling distribution is impacted by sample size. As the sample size increases the standard error decreases. With a larger sample size there is less variation between sample statistics, or in this case bootstrap statistics. Let's look at how this impacts a confidence interval.
Example: Proportion of Dog Owners Section
Below are two bootstrap distributions with 95% confidence intervals. In both examples \(\widehat p = 0.60\). However, the sample sizes are different.
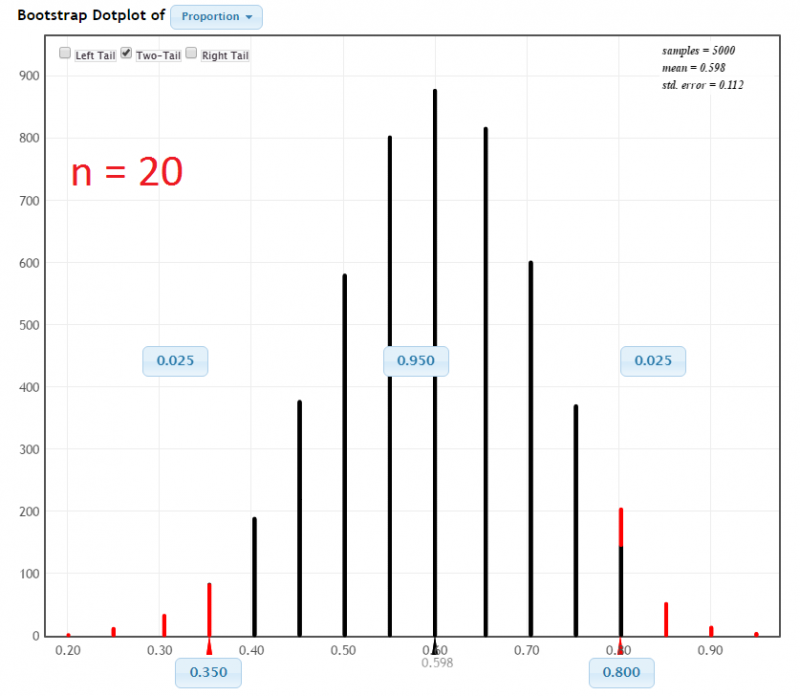
In a sample of 20 World Campus students 12 owned a dog. StatKey was used to construct a 95% confidence interval using the percentile method:
In a sample of 200 World Campus students, 120 owned a dog. StatKey was used to construct a 95% confidence interval using the percentile method:
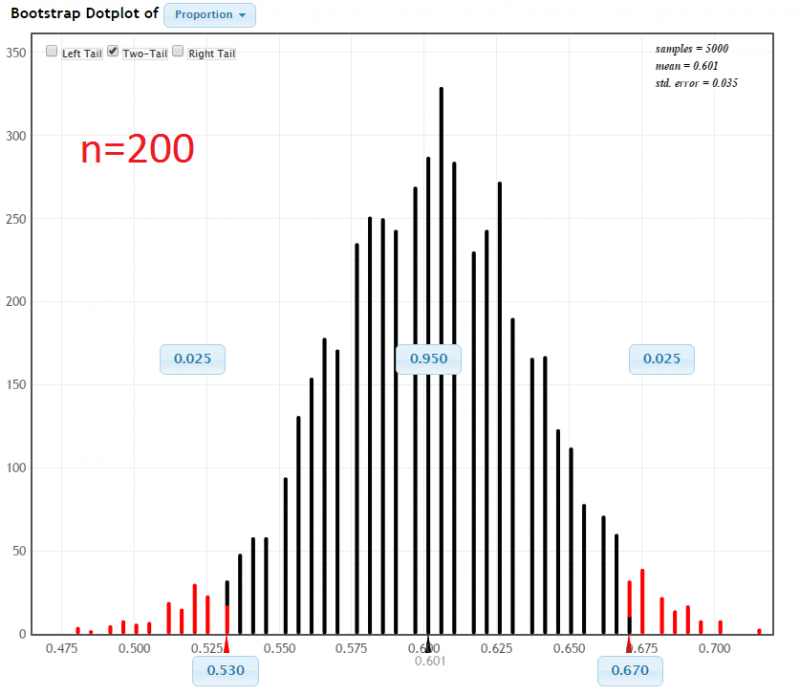
In each of the examples the proportion of dog owners was \(\widehat p = 0.60\). The difference was the sample size. When the sample size was increased from 20 to 200 the confidence interval became more narrow: from [0.350, 0.800] to [0.530, 0.670].