Construct a model using quiz averages to predict final exam scores.
This example uses the exam data set found in this Minitab file: Exam.mpx
- \(H_0\colon \beta_1 =0\)
- \(H_a\colon \beta_1 \neq 0\)
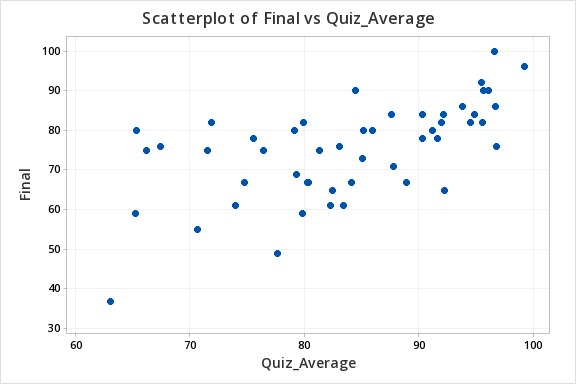
The scatterplot below shows that the relationship between quiz average and final exam score is linear (or at least it's not non-linear).
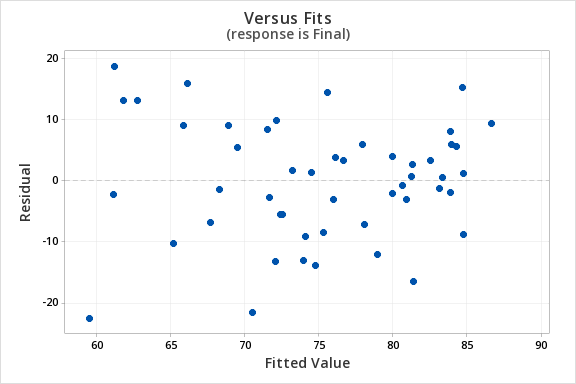
The plot of residuals versus fits below can be used to check the assumptions of independent errors and equal error variances. There is not a significant correlation between the residuals and fits, therefore the assumption of independent errors has been met. The variance of the residuals is relatively consistent for all fitted values, therefore the assumption of equal error variances has been met.
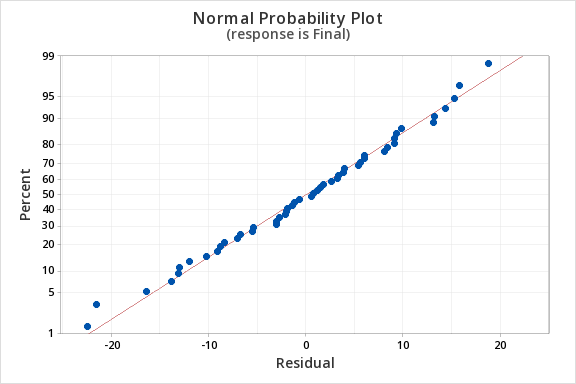
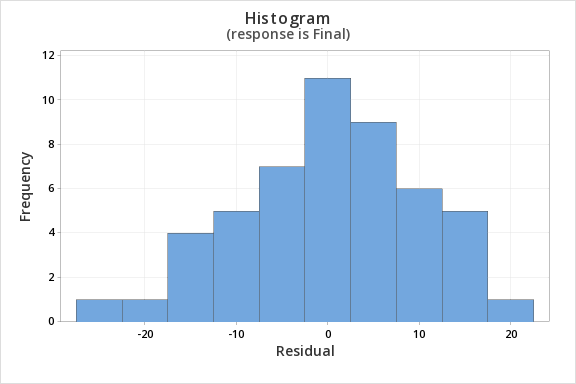
Finally, we must check for the normality of errors. We can use the normal probability plot below to check that our data points fall near the line. Or, we can use the histogram of residuals below to check that the errors are approximately normally distributed.
Now that we have check all of the assumptions of simple linear regression, we can examine the regression model.
We will use the coefficients table from the Minitab output.
Coefficients
Term | Coef | SE Coef | T-Value | P-Value | VIF |
|---|---|---|---|---|---|
Constant | 12.1 | 11.9 | 1.01 | 0.315 | |
Quiz_Average | 0.751 | 0.141 | 5.31 | 0.000 | 1.00 |
\(t = 5.31\)
\(p=0.000\)
\(p < \alpha\), reject the null hypothesis
There is convincing evidence that that students' quiz averages can be used to predict their final exam scores in the population.