In the population of Americans who drink coffee, the average daily consumption is 3 cups per day. A university wants to know if their students tend to drink more coffee than the national average. They ask a random sample of 50 students how many cups of coffee they drink each day and found \(\overline{x}=3.8\) and \(s=1.5\). Do they have convincing evidence that their students drink more than the national average?
Amount of coffee consumed is a quantitative variable. We are given that random sampling methods were employed. Because \(n \ge 30\), we can approximate the sampling distribution using a t distribution.
This is a right-tailed test because we want to know if the mean in the sample is greater than the national average.
\(H_{0}:\mu= 3\)
\(H_{a}:\mu>3\)
Test Statistic: One Group Mean
\(t=\dfrac{\overline{x}-\mu_0}{\dfrac{s}{\sqrt{n}}}\)
\(\overline{x}\) = sample mean
\(\mu_{0}\) = hypothesized population mean
\(s\) = sample standard deviation
\(n\) = sample size
\(t=\dfrac{\overline{x}-\mu_0}{\dfrac{s}{\sqrt{n}}}=\dfrac{3.8-3}{\dfrac{1.5}{\sqrt{50}}}=3.771\)
Our \(t\) test statistic is 3.771
\(df=n-1=50-1=49\)
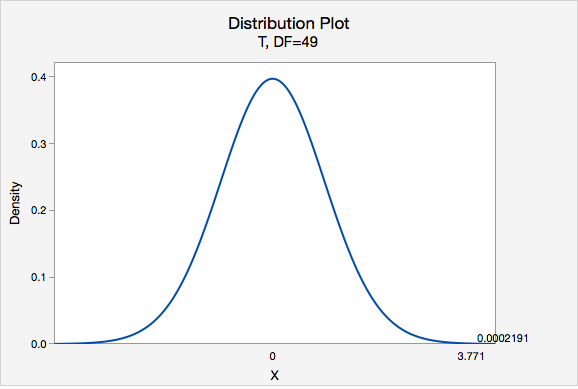
Using Minitab, we can find that \(P(t > 3.771) =0.0002191\)
p-value = 0.0002191
If \(\mu=3\), then the probability of taking a random sample of \(n=50\) and finding \(\overline{x} \geq 3\) is 0.0002191
\(p\leq.05\), therefore we reject the null hypothesis.
There is convincing evidence to state the mean number of coffees consumed in the population of all students at this university is greater than 3.