Hypothesis Testing Examples Section
The following examples demonstrate the five steps of hypothesis testing.
Research question: Is the mean body temperature in the population different from 98.6° Fahrenheit?
Research question: Is there a positive correlation in the population between the price of an ink jet printer and how many pages per minute (ppm) it prints?
Research question: Is the proportion of NFL overtime coin tosses that are won different from 0.50?
StatKey was used to construct a randomization distribution:
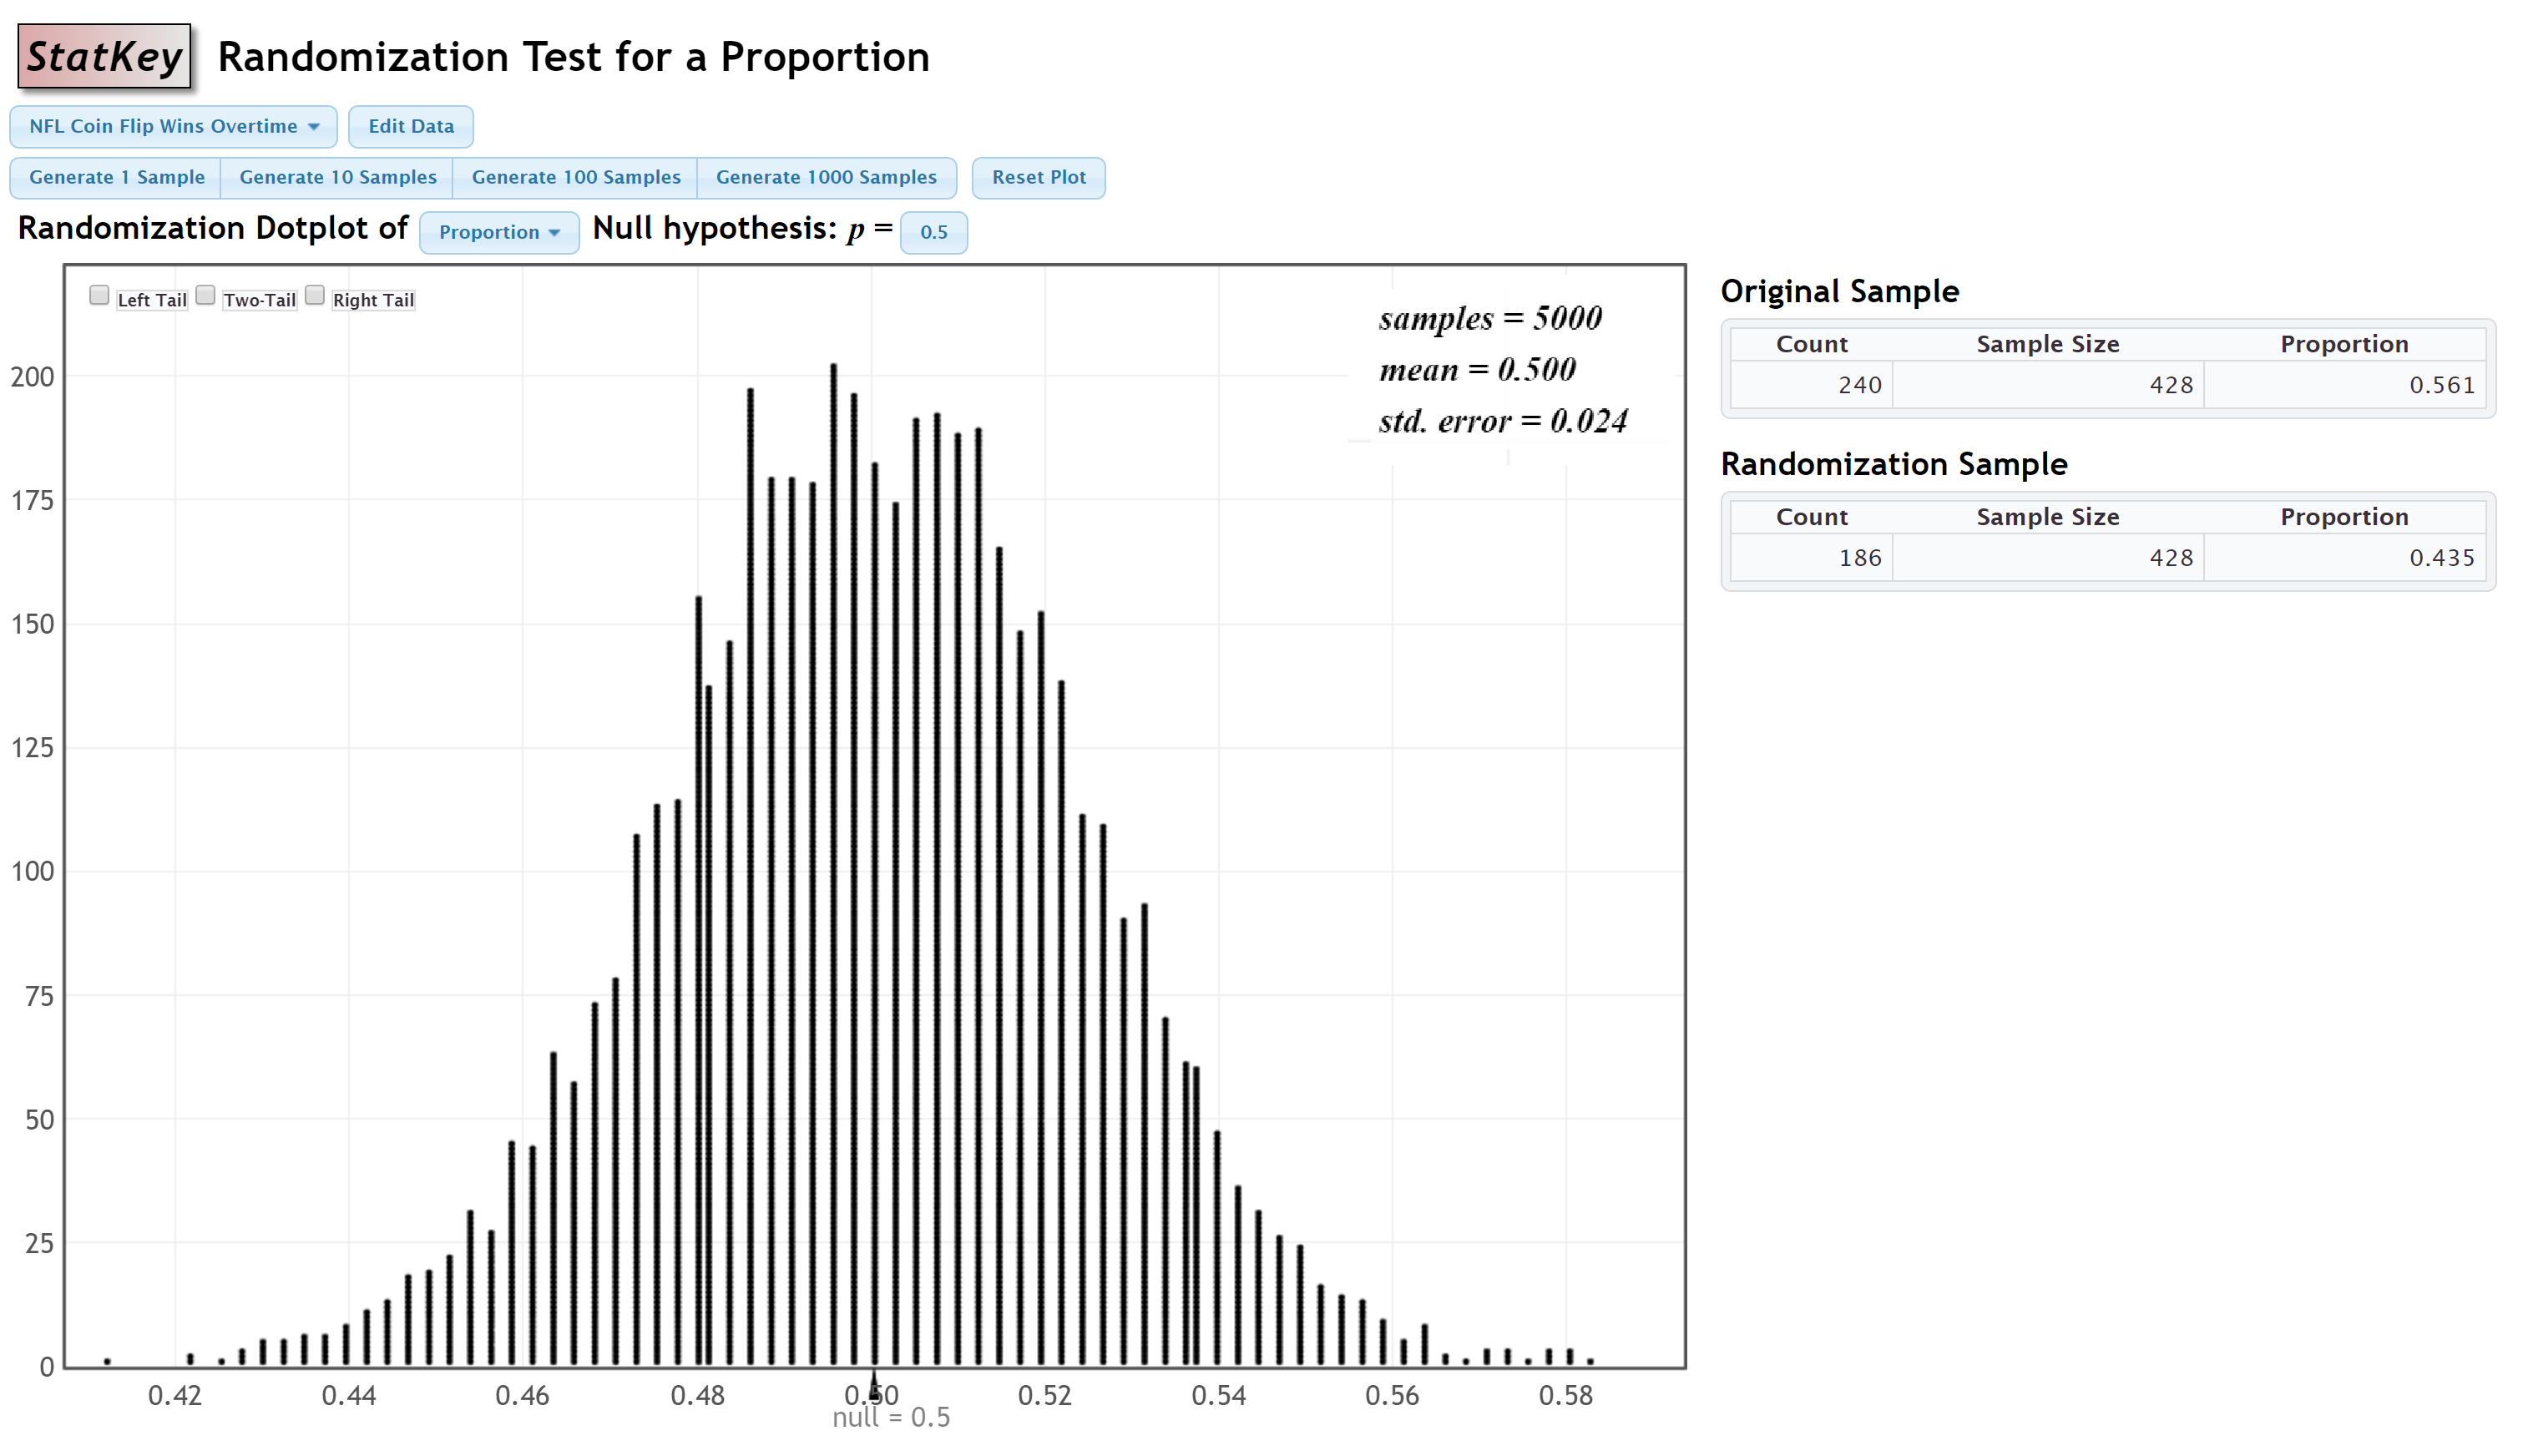
Step 1: Check assumptions and write hypotheses
From the given StatKey output, the sampling distribution is approximately normal.
\(H_0: p=0.50\)
\(H_a: p \ne 0.50\)
Step 2: Calculate the test statistic
\(test\;statistic=\frac{sample\;statistic-null\;parameter}{standard\;error}\)
The sample statistic is the proportion in the original sample, 0.561. The null parameter is 0.50. And, the standard error is 0.024.
\(test\;statistic=\frac{0.561-0.50}{0.024}=\frac{0.061}{0.024}=2.542\)
Step 3: Determine the p value
The p value will be the area on the z distribution that is more extreme than the test statistic of 2.542, in the direction of the alternative hypothesis. This is a two-tailed test:
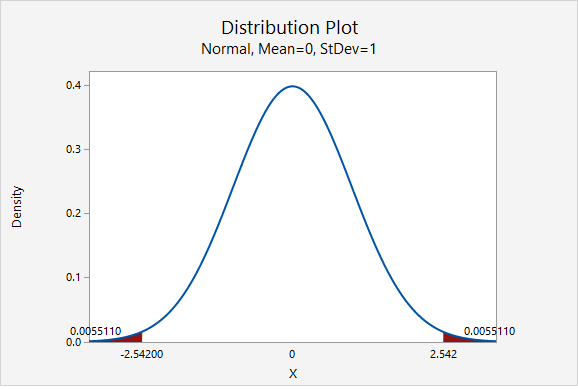
The p value is the area in the left and right tails combined: \(p=0.0055110+0.0055110=0.011022\)
Step 4: Make a decision
The p value (0.011022) is less than the standard 0.05 alpha level, therefore we reject the null hypothesis.
Step 5: State a "real world" conclusion
There is evidence that the proportion of all NFL overtime coin tosses that are won is different from 0.50
Research question: Are more than 50% of all World Campus STAT 200 students female?
Data were collected from a representative sample of 501 World Campus STAT 200 students. In that sample, 284 students were female and 217 were male.
StatKey was used to construct a sampling distribution using randomization methods:
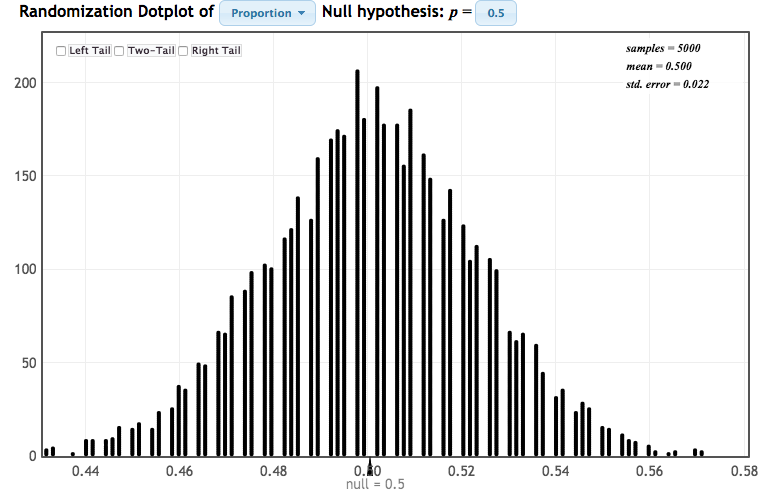
Because this sampling distribution is approximately normal, we can find the p value by computing a standardized test statistic and using the z distribution.
Step 1: Check assumptions and write hypotheses
The assumption here is that the sampling distribution is approximately normal. From the given StatKey output, the sampling distribution is approximately normal.
\(H_0: p=0.50\)
\(H_a: p>0.50\)
2. Calculate the test statistic
\(test\;statistic=\frac{sample\;statistic-hypothesized\;parameter}{standard\;error}\)
The sample statistic is \(\widehat p = 284/501 = 0.567\).
The hypothesized parameter is the value from the hypotheses: \(p_0=0.50\).
The standard error on the randomization distribution above is 0.022.
\(test\;statistic=\frac{0.567-0.50}{0.022}=3.045\)
3. Determine the p value
We can find the p value by constructing a standard normal distribution and finding the area under the curve that is more extreme than our observed test statistic of 3.045, in the direction of the alternative hypothesis. In other words, \(P(z>3.045)\):
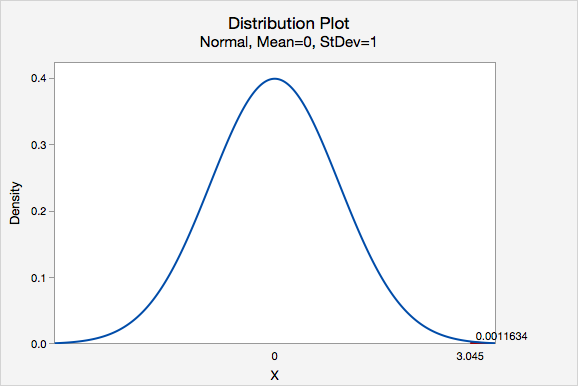
Our p value is 0.0011634
4. Make a decision
Our p value is less than or equal to the standard 0.05 alpha level, therefore we reject the null hypothesis.
5. State a "real world" conclusion
There is evidence that the proportion of all World Campus STAT 200 students who are female is greater than 0.50.