Exampe 2-1 Section
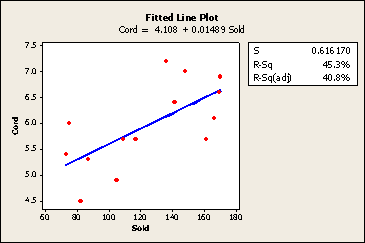
Is there a positive relationship between sales of leaded gasoline and the lead burden in the bodies of newborn infants? Researchers (Rabinowitz, et al, 1984) who were interested in answering this research question compiled data (Lead Cord data) on the monthly gasoline lead sales (in metric tons) in Massachusetts and mean lead concentrations (µl/dl) in umbilical-cord blood of babies born at a major Boston hospital over 14 months in 1980-1981.
Analyzing their data, the researchers obtained the following Minitab fitted line plot:

and standard regression analysis output:
Analysis of Variance
| Source | DF | Adj SS | Adj MS | F-Value | P-Value |
|---|---|---|---|---|---|
| Regression | 1 | 3.7783 | 3.7783 | 9.95 | 0.008 |
| Residual Error | 12 | 4.5560 | 0.3797 | ||
| Total | 13 | 8.3343 |
Model Summary
| S | R-sq | R-sq(adj) |
|---|---|---|
| 0.616170 | 45.3% | 40.8% |
Coefficients
| Predictor | Coef | SE Coef | T-Value | P-Value |
|---|---|---|---|---|
| Constant | 4.1082 | 0.6088 | 6.75 | 0.000 |
| Sold | 0.014885 | 0.004719 | 3.15 | 0.008 |
Regression Equation
Cord = 4.11 + 0.0149 Sold
Minitab reports that the P-value for testing \(H_{0} \colon \beta_{1} = 0\) against the alternative hypothesis \(H_{A} \colon \beta_{1} ≠ 0\) is 0.008. Therefore, since the test statistic is positive, the P-value for testing \(H_{0} \colon \beta_{1}= 0\) against the alternative hypothesis \(H_{A} \colon \beta_{1} > 0\) is 0.008 ÷ 2 = 0.004. The P-value is less than 0.05. There is sufficient statistical evidence, at the 0.05 level, to conclude that \(\beta_{1} > 0\).
Furthermore, since the 95% t-multiplier is \(t_{\left(0.025, 12 \right)} = 2.1788\), a 95% confidence interval for \(\beta_{1}\) is:
0.014885 ± 2.1788(0.004719) or (0.0046, 0.0252).
The researchers can be 95% confident that the mean lead concentrations in the umbilical-cord blood of Massachusetts babies increase between 0.0046 and 0.0252 µl/dl for every one-metric ton increase in monthly gasoline lead sales in Massachusetts. It is up to the researchers to debate whether or not this is a meaningful increase.