Is the natural log transformation the only transformation available to you? The answer is no — it just happens to be the only transformation we have investigated so far. We'll try to take care of any misconceptions about this issue in this section, in which we briefly enumerate other transformations you could try in an attempt to correct problems with your model. One thing to keep in mind though is that transforming your data almost always involves lots of trial and error. That is, there are no cut-and-dried recipes. Therefore, the best we can do is offer advice and hope that you find it helpful!
The first piece of advice
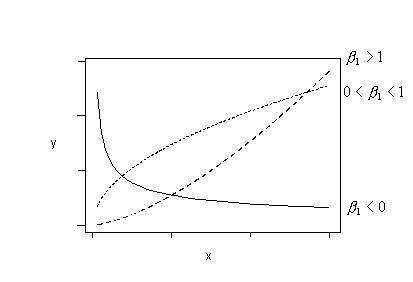
If the primary problem with your model is non-linearity, look at a scatter plot of the data to suggest transformations that might help. (This only works for simple linear regression models with a single predictor. For multiple linear regression models, look at residual plots instead.) Remember, it is possible to use transformations other than logarithms:
If the trend in your data follows either of these patterns, you could try fitting this regression function:
\(\mu_Y=\beta_0+\beta_1e^{-x}\)
to your data.
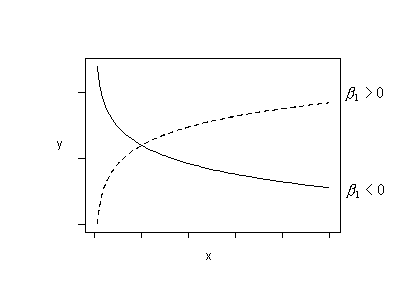
Or, if the trend in your data follows either of these patterns, you could try fitting this regression function:
\(\mu_Y=\beta_0+\beta_1\left(\frac{1}{x}\right)\)
to your data. (This is sometimes called a "reciprocal" transformation.)
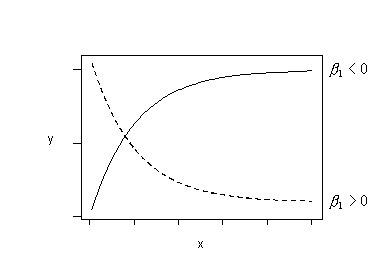
Or, if the trend in your data follows either of these patterns, try fitting this regression function:
\(\mu_{lnY}=\beta_0+\beta_1x\)
to your data. That is, fit the model with ln(y) as the response and x as the predictor.
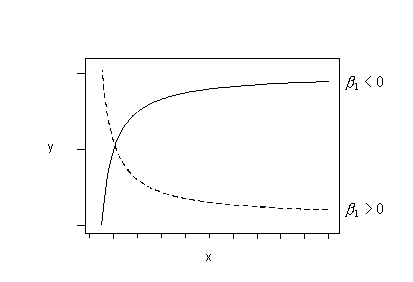
Or, try fitting this regression function:
\(\mu_Y=\beta_0+\beta_1ln(x)\)
if the trend in your data follows either of these patterns. That is, fit the model with y as the response and ln(x) as the predictor.
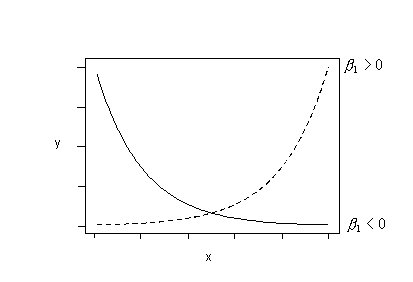
And, finally, try fitting this regression function:
\(\mu_{lnY}=\beta_0+\beta_1ln(x)\)
if the trend in your data follows any of these patterns. That is, fit the model with ln(y) as the response and ln(x) as the predictor.
The second piece of advice
If the variances are unequal and/or error terms are not normal, try a "power transformation" on y. A power transformation on y involves transforming the response by taking it to some power \(\lambda\). That is \(y^*=y^{\lambda}\). Most commonly, for interpretation reasons, \(\lambda\) is a "meaningful" number between -1 and 2, such as -1, -0.5, 0, 0.5, (1), 1.5, and 2 (i.e., it's rare to see \(\lambda=1.362,\) for example). When \(\lambda = 0\), the transformation is taken to be the natural log transformation. That is \(y^*=ln(y)\). One procedure for estimating an appropriate value for \(\lambda\) is the so-called Box-Cox Transformation, which we'll explore further in the next section.
The third piece of advice
If the error variances are unequal, try "stabilizing the variance" by transforming y:
- If the response y is a Poisson count, the variances of the error terms are not constant but rather depend on the value of the predictor. A common (now archaic?) recommendation is to transform the response using the "square root transformation," \(y^*=\sqrt{y}\), and stay within the linear regression framework. Perhaps, now, the advice should be to use "Poisson regression" (which we'll cover in the optional content).
- If the response y is a binomial proportion, the variances of the error terms are not constant but rather depend on the value of the predictor. Another common (now archaic?) recommendation is to transform the response using the "arcsine transformation," \(\hat{p}^*=sin^{-1}\left(\sqrt{\hat{p}}\right)\), and stay within the linear regression framework. Perhaps, now, the advice should be to use a form of "logistic regression" (which we'll cover in the Lesson 13).
- If the response y isn't anything special, but the error variances are unequal, a common recommendation is to try the natural log transformation \(y^*=ln(y)\) or the "reciprocal transformation" \(y^*=\frac{1}{y}\).
And two final pieces of advice...
- It's not really okay to remove some data points just to make the transformation work better, but if you do make sure you report the scope of the model.
- It's better to give up some model fit than to lose clear interpretations. Just make sure you report that this is what you did.