Recall that the second condition — the "I" condition — of the linear regression model is that the error terms are independent. In this section, we learn how to use a "residuals vs. order plot" as a way of detecting a particular form of non-independence of the error terms, namely serial correlation. If the data are obtained in time (or space) sequence, a residuals vs. order plot helps to see if there is any correlation between the error terms that are near each other in the sequence.
The plot is only appropriate if you know the order in which the data were collected! Highlight this, underline this, circle this, ..., er, on second thought, don't do that if you are reading it on a computer screen. Do whatever it takes to remember it though — it is a very common mistake made by people new to regression analysis.
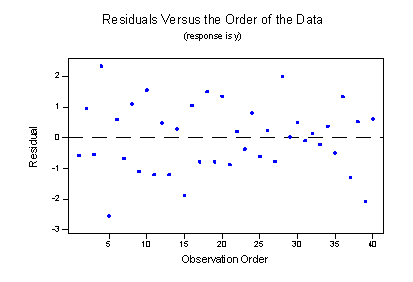
So, what is this residuals vs. order plot all about? As its name suggests, it is a scatter plot with residuals on the y-axis and the order in which the data were collected on the x-axis. Here's an example of a well-behaved residual vs. order plot:
The residuals bounce randomly around the residual = 0 line as we would hope so. In general, residuals exhibiting normal random noise around the residual = 0 line suggests that there is no serial correlation.
Let's take a look at examples of the different kinds of residuals vs. order plots we can obtain and learn what each tells us.
A time trend Section
Residuals vs. order plot that exhibits (positive) trend as the following plot does:
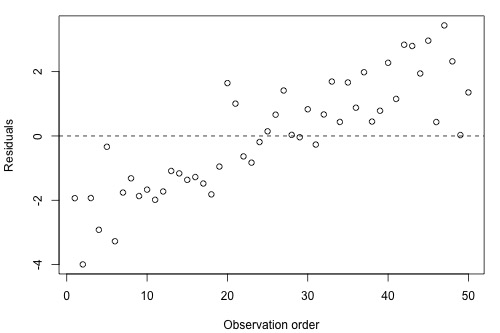
suggests that some of the variations in the response are due to time. Therefore, it might be a good idea to add the predictor "time" to the model. That is, you interpret this plot just as you would interpret any other residual vs. predictor plot. It's just that here your predictor is "time."
Positive serial correlation Section
A residuals vs. order plot that looks like the following plot:
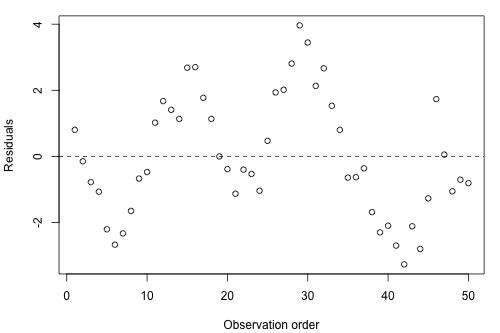
suggests that there is a "positive serial correlation" among the error terms. That is, a positive serial correlation exists when residuals tend to be followed, in time, by residuals of the same sign and about the same magnitude. The plot suggests that the assumption of independent error terms is violated.
Here is another less obvious example of a data set exhibiting positive serial correlation:
Can you see a cyclical trend -- up and then down, up and down, and up again? If not, drag the arrow on the left side across the graph. Certainly, the positive serial correlation in the error terms is not as obvious here as in the previous example. These two examples taken together are a nice illustration of "the severity of the consequences is related to the severity of the violation." The violation in the previous example is much more severe than in this example. Therefore, we should expect that the consequences of using a regression model in the previous example would be much greater than using one in this example. In either case, you would be advised to move out of the realm of regression analysis and into that of "time series modeling."
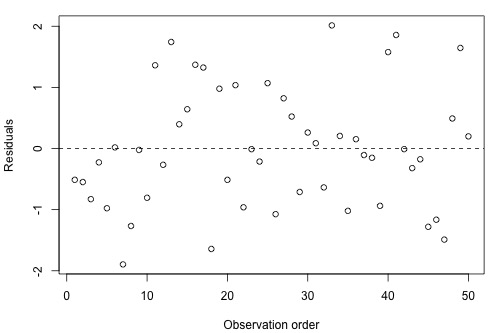
Negative serial correlation Section
A residuals vs. order plot that looks like the following plot:
suggests that there is a "negative serial correlation" among the error terms. A negative serial correlation exists when residuals of one sign tend to be followed, in time, by residuals of the opposite sign. What? Can't you see it? If you connect the dots in order from left to right, you should be able to see the pattern. If you can't see it, drag the arrow on the left across the image:
Negative, positive, negative, positive, negative, positive, and so on. The plot suggests that the assumption of independent error terms is violated. If you obtain a residuals vs. order plot that looks like this, you would again be advised to move out of the realm of regression analysis and into that of "time series modeling."