Minitab® – Procedure
You may need to find a P-value if you are using the P-value approach to conduct a hypothesis test that uses an F-statistic.
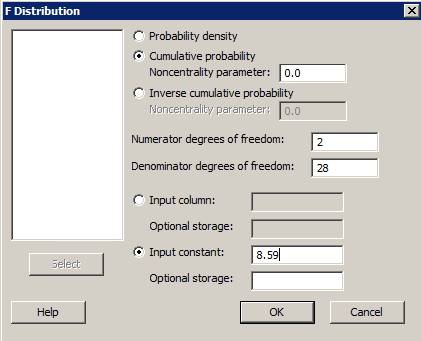
- Select Calc >> Probability Distributions >> F ...
- Click the button labeled Cumulative probability. (Leave the non centrality parameter set as the default of 0.)
- Type the number of numerator degrees of freedom in the box labeled Numerator degrees of freedom, and type the number of the denominator degrees of freedom in the box labeled Denominator degrees of freedom.
- Click the button labeled Input constant. In the box, type the value of your F-statistic for which you want to find the associated cumulative probability.
- Select OK. The cumulative probability will appear in the session window. The P-value is 1 minus the reported cumulative probability.
Example
The coolhearts.txt data set contains the following data on 32 rabbits subjected to a heart attack:
- yi is the size of the infarcted area (in grams) of rabbit i
- xi1 is the size of the region at risk (in grams) of rabbit i
- xi2 = 1 if early cooling of rabbit i, 0 if not
- xi3 = 1 if late cooling of rabbit i, 0 if not
It can be shown that the partial F-statistic for testing H0 : β2 = β3 = 0 is 8.59 with 2 numerator and 28 denominator degrees of freedom. Find the F-based P-value so that you can draw a conclusion about the hypothesis.
Minitab Dialog Box
Sample Minitab Output
Cumulative Distribution Function
F distribution with 1 DF in numerator and 28 DF in denominator
| x | P ( X ≤ x) |
|---|---|
| 8.59 | 0.998767 |
The P-value is therefore 1 - 0.9988 or 0.0012.