Minitab® – Procedure
- In Minitab, select Data >> Display Data...
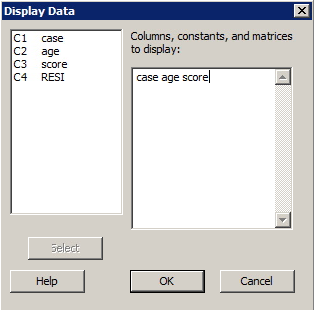
- In the box labeled Columns, constants, and matrices to display, specify the variables that you would like displayed.
- Select OK. The data will be displayed in the session window.
Example
Display the data contained in the adaptive.txt data set.
Minitab dialog box
Sample output
Results for: Worksheet 2
Data Display
| Row | case | age | score |
|---|---|---|---|
| 1 | 1 | 15 | 95 |
| 2 | 2 | 26 | 71 |
| 3 | 3 | 10 | 83 |
| 4 | 4 | 9 | 91 |
| 5 | 5 | 15 | 102 |
| 6 | 6 | 20 | 87 |
| 7 | 7 | 18 | 93 |
| 8 | 8 | 11 | 100 |
| 9 | 9 | 8 | 104 |
| 10 | 10 | 20 | 94 |
| 11 | 11 | 7 | 113 |
| 12 | 12 | 9 | 96 |
| 13 | 13 | 10 | 83 |
| 14 | 14 | 11 | 84 |
| 15 | 15 | 11 | 102 |
| 16 | 16 | 10 | 100 |
| 17 | 17 | 12 | 105 |
| 18 | 18 | 42 | 57 |
| 19 | 19 | 17 | 121 |
| 20 | 20 | 11 | 86 |
| 21 | 21 | 10 | 100 |