Minitab® – Procedure
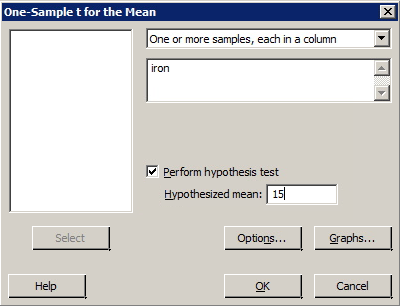
- Select Stat >> Basic Statistics >> 1 Sample t ...
- If it is not already done so, use the pull-down options to select, 'Samples in columns'.
- Select the variable you want to analyze by clicking or by highlighting and clicking once on 'Select', so it appears in the box labeled 'Samples in columns'.
- In the box labeled 'Test mean', type the assumed value of the mean under the null hypothesis.
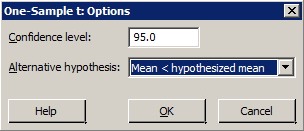
- Select Options ... (Ignore the box labeled 'Confidence level'.) For the box labeled 'Alternative', use the pull-down options to select the direction of the alternative hypothesis (less than, not equal, greater than).
- Select OK.
- Select OK. The output will appear in the session window.
Example
The US National Research Council currently recommends that females between the ages of 11 and 50 intake 15 milligrams of iron daily. The iron intakes of a random sample of 25 such American females are found in the dataset irondef.txt. Is there evidence that the population of American females is, on average, getting less than the recommended 15 mg of iron? That is, should we reject the null hypothesis H0: μ = 15 against the alternative HA: μ < 15? Using Minitab, determine a 95% confidence interval for μ, the mean iron intake of all women in the population.
Minitab Dialog Boxes

Sample Minitab Output
One-Sample T: iron
Test of \(\mu=15 \text { vs }<15\)
| Variable | N | Mean | StDev | SE Mean | 95% Upper Bound | T | P |
|---|---|---|---|---|---|---|---|
| iron | 25 | 14.300 | 2.367 | 0.473 | 15.110 | -1.48 | 0.076 |
