Minitab® – Procedure (v.16 & v.17)
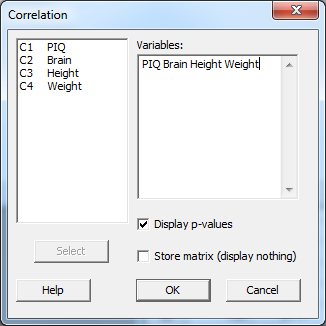
- Select Stat >> Basic statistics >> Correlation...
- In the box labeled Variables, specify the two (or more) variables for which you want the correlation coefficient(s) calculated.
- If you would like a P-value so that you can test that each population correlation is 0, put a checkmark in the box labeled Display p-values by clicking once on the box.
- Select OK. The output will appear in the session window.
Example
Using the iqsize.txt data set, estimate the correlations among each pair of the four variables.
Minitab Dialog Box

Resulting Minitab Output
Correlations: PIQ, Brain, Height, Weight
| PIQ | Brain | Height | |
|---|---|---|---|
| Brain | 0.378 | ||
| 0.019 | |||
| Height | -0.093 | 0.588 | |
| 0.578 | 0.000 | ||
| Weight | 0.003 | 0.513 | 0.700 |
| 0.988 | 0.001 | 0.000 | |
P-Value